1. Home > 
  2. Stock Photos > 
  3. Digital Financial Data Interfaces in Global Connection

Digital Financial Data Interfaces in Global Connection Image

Digital Financial Data Interfaces in Global Connection

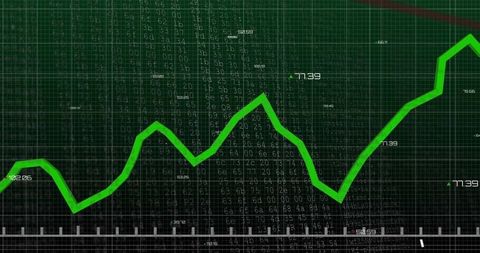
Detailed view of a financial interface showcasing real-time stock market data against a dark digital background. The prominent green line graph represents market trends and analytics, useful for presentations and content involving economics, finance, technology-driven investments, and global business strategies.

Powered by Shutterstock logo - Get 15% off with code: PIKWIZARD15
Businessman Engaged in Global Digital Financial Trading Analysis Concept - Powered by Shutterstock - Get 15% off with code: PIKWIZARD15Image of stock market data processing and spinning globe against cameroon flag. Global finance and business technology concept - Powered by Shutterstock - Get 15% off with code: PIKWIZARD15Image of globe of plexus networks, statistical, stock market data processing against cityscape. Global economy and business networking technology concept - Powered by Shutterstock - Get 15% off with code: PIKWIZARD15Global Financial Network: Stock Market Data Visualization - Powered by Shutterstock - Get 15% off with code: PIKWIZARD15Global Business Investment finance chart,stock market business and exchange financial growth graph.	 Elements furnished by NASA - Powered by Shutterstock - Get 15% off with code: PIKWIZARD15

Credit Photo

If you would like to credit the Photo, here are some ways you can do so

Free (free of charge)

Free for personal and commercial use.

Author: Awesome Content

Similar Free Stock Images

Green Data Graph on Black Digital Interface
Premium
Global marketing and finance strategy supports business expansion through international planning, digital tools, and cross-border marketing for global success. Latch
Digital Financial Chart with Green Trend Line on Grid Background
Red Line Graph Over Histogram Representing Financial Volatility
Financial Data Chart Over City Silhouette
Data Analysis and Cybersecurity Concept Art
Premium
woman Hand holding virtual Global Internet connection metaverse. Business global internet connection application technology and digital marketing, Financial and banking, Digital link tech, big data.
Dynamic Financial Graph with Growth Patterns on Digital Screen
Red Line Chart Trending Downward in Data Visualization
Premium
Growth of cryptocurrencies and global stocks. Finance graph trade and profit investment.Global financial trading business stock market chart.Development to success.Elements furnished by NASA.
Dynamic Financial Chart with Red Line Graph on Digital Interface
Financial Graph with Data Analysis and Market Statistics
Green Line Graph on Dark Digital Grid
Thick red trend line declining across dashboard grid with green markers and labels
Premium
Image of stock market data processing and globe over diverse man and woman discussing at office. Global economy and business technology concept
Digital Display of Stock Market Data and Graphs
Digital Financial Data and Global Market Analysis on Graph
Dynamic Stock Market Graphs with Trends and Data Alerts
Digital Interface with Data Processing Visualization
Premium
Transparent globe overlaying financial data displays, showing stock percentages. Bright colors and digital effects highlight global economic activities
Stock Market Showing Declining Trend with Numbers and Graph
Sharp Decline in Stock Market Graph Against Red Financial Data Background
Digital Financial Data Analytics and Economic Trends
Financial Graph and Cityscape Analysis with Technological Overlay
Premium
Image of stock market data processing over world map against black background. Global economy and business technology concept
Colorful Financial Data Charts on Digital Grid Background
Financial Data Streaming with Arrows Over Graphic Indicators
Dynamic Stock Market Data Display in Red and Green Ticker
Falling Stock Market Graph with Data on Black Screen
Financial Data Graph Over Cityscape with Digital Overlay
Financial Growth Chart with Dynamic Green Line on Grid Overlay
Futuristic green analytics dashboard displaying jagged trend line on gridded interface
Financial Data Charts with World Map on Blue Digital Background
Premium
Businessman holding Global network connection. Stock market or forex trading graph and candlestick chart suitable for financial investment concept. Global data information and technology exchange
Abstract Digital Data with Upward Trending Line Graph
Premium
Image of financial and stock market data processing over globe against computer server room. Global economy and business data storage technology concept
Binary Code and Financial Data on Digital Screen
Green Trend Line on Dark Grid Represents Economic Growth
Digital Data Processing Interface with Code and Graph
Premium
Displaying finance floating at digital trading display, with tickers percent values and globe icons. Finance, technology, globalization, data visualization, connectivity, investment, business
Declining Graph with 49% Reduction on Dark Digital Background
Dynamic Green Line Graph Showing Financial Data Fluctuations
Dynamic Financial Stock Market Display with Analytical Data
Cybersecurity Warnings Overlaid on Financial Data and Stock Market Graph
Premium
Global financial trading business stock market chart. Growth of cryptocurrencies and global stocks. Finance graph trade and profit investment.Development to success.Elements furnished by NASA.
Digital Financial Report Analysis Overlaid on Office Scene
Dynamic Red Line Graph With Data Points on Gridded Background
Dynamic Financial Chart Illustrating Stock Market Volatility
Premium
Displaying globe icons encircled by arrows floating over skyline, with candlestick charts, tickers. Globalization, connectivity, finance, trading, technology, urban, digital
Digital Financial Data Graph on Black Screen Background
Rising Stock Market Trends and Chart Analysis
Dynamic Chart Displaying Fluctuating Financial Data Trends
Stock Market Decline Display with Falling Red Graph Line
Green Line Rising on Digital Trading Board with Abstract Background
Dynamic Financial Graph with Candlestick Patterns and Percentage Metrics
Binary Code Financial Analytics with Rising Graph Line
Digital Stock Market Graph with Abstract Coding Background
Premium
global business and invest concept. global on computer with volume investment of stock market background.
Premium
Image of financial data processing and stock market with caucasian man over empty warehouse. global shipping, delivery and connections concept digitally generated image.
Digital Lock with Real-Time Data Display
Fluctuating Financial Stock Market with Digital Display
Fluctuating Stock Market Display with Financial Data and Analytics
Rising Green Line Chart Overlays Concept of Financial Growth
World Map with Falling Line Graphs Indicating Global Economic Decline
Fluctuating Financial Graph on Digital Orange Background
Digital Stock Market Green Graph Against Dark Trading Board
Analyzing Financial Charts on Digital Screen
Abstract Graph with Social Media Notification Icons and Data Points
Digital Graph over Stock Market Data Concepts
Dynamic Financial Data Representation on Digital Grid
Digital Green Line Graph Over Grid with Statistics and Numbers
Digital Financial Data and Multicurrency Exchange Charts
Dynamic Line Chart Representing Financial Data Growth
Digital Data Analysis with Green Line Graph on Grid Background
Premium
Spinning 3D Earth globe rotating in virtual financial data interface, with symbols and line charts. Globes, finance, data visualization, technology, investment, analytics, digital
Green Graph Showing Forex Trends on Transparent Cyber Interface
Digital Financial Analytics with Red Trends on Grid Screen
Abstract Digital Stock Market Trends and Charts Analysis
Green Financial Line Chart Over Modern Office Buildings
Dynamic Financial Data Visualization over Urban Silhouette
Green Line Graph with Data Points on Grid Background
Green Line Graph Overlapping Data Server Racks in Technology Center
Dynamic Stock Market Data with Fluctuating Graph
Premium
Economic business growth on global business network. Social networking service.  Digital marketing and data analysis of financial.
Analyzing Growing Graph Line on Purple Gradient Background
Premium
Business global internet connection application technology and digital marketing, Financial and banking, Digital link tech, big data. woman Hand holding virtual Global Internet connection metaverse.
Green Financial Line Graph with Candlestick Data on Grid Background
Fluctuating Stock Market Graph with Symbols and Percentages
Fluctuating Red Line on Digital Analytics Dashboard
Futuristic Graph and Data Visualization Interface Design
Premium
Virtual Global Internet connection. Business technology and digital marketing. Financial, banking, big data, e-commerce, cloud computing, solution of creating new opportunities.
Premium
Businessman Interacting with Virtual Financial Stock Market Data
Data Analysis Process with Green Digital Interface
Financial Data Through Digital Networks with Stock Market Growth Trend
Fluctuating Financial Graph on Green Grid Background
Dynamic Digital Data Dashboard with Analytics Charts and Graphs
Premium
Image of statistical and stock market data processing over spinning globe against tall buildings. Global economy and business data technology concept
Growth Trend with Green Line Overlay and Modern Cityscape
Digital Interface Displaying Volatile Financial Market Analysis
Economic Trends Analysis with Financial Indicators and Graphs
Premium
Businessman using digital tablet on global network connection, data exchange, business development, metaverse. Internet technology, digital marketing. Financial, banking, investment, global business
Cryptocurrency Growth Chart Over Digital World Map
Green Line Chart on 3D Digital Graph for Financial Analysis
Dynamic Financial Data on Dark Background With Colorful Graphs
Premium
Global business, finance and investment concept. Businessman using digital tablet analyzing business data report with financial graph, Business target, strategy and planning. market research
Rising Graph Line on Digital Green Grid Background
Dynamic Financial Graph with Changeable Metrics Over Green Line
Futuristic Data Processing Interface with Dynamic Graphs
Fluctuating Digital Stock Market Data Chart
Premium
hand shows the globe. concept of global internet connection big data digital link technology, and business digital marketing. internet banking, Financial, business tech international market
Declining Financial Market Chart Over Grid Background
Premium
Global financial markets concept. . Mixed media
Dynamic Financial Stock Market Analysis Display
Stock Market Decline with Red Graph Showing Slump in Financial Markets
Abstract Digital Graph with Data Points and Grid
Premium
Image of statistical and stock market data processing over spinning globe against server room. Global economy and business data storage technology concept
Digital Currency Trading Interface with Data Visualization
Financial Market Growth Over City Skyline
Futuristic Data Trend Graphs on Digital Interface
Dynamic Stock Market Graph with Data Metrics Background
Digital Data Processing Interface with Green Growth Chart
Declining Stock Market Graph with Red Trend Line
Dynamic Data Visualization with Fluctuating Trendline and Indicators
Red Zigzag Graph on Digital Analytics Dashboard Interface
Premium
Multiple trading screens display stock charts with a digital globe overlay, symbolizing international finance, data flow, and market connectivity.
Explore More Free Stock Images