1. Home > 
  2. Stock Photos > 
  3. Digital Financial Data Overlay on Server Infrastructure

Digital Financial Data Overlay on Server Infrastructure Image

Digital Financial Data Overlay on Server Infrastructure

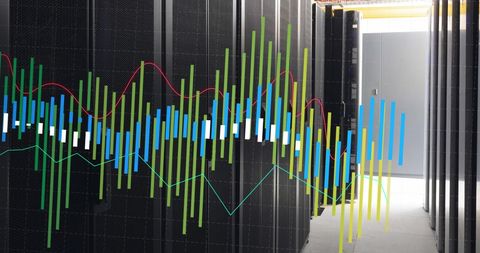
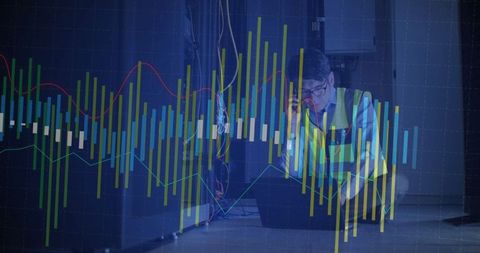
Abstract representation of financial data integrated with server infrastructure visuals. Captures the intertwined relationship between finance and technology, illustrating the flow of digital financial information. Ideal for use in articles or presentations focused on fintech innovations, data centers, global business analytics, and financial technology processes. Can be used in educational materials highlighting the impact of technology on finance industry or marketing content discussing IT services for financial institutions.

Powered by Adobe logo
A cloud computing platform for enterprise business solutions. A central system for data storage, security, processing, and application hosting. Motif - Powered by AdobeData center servers with cityscape view. Financial graph and dashboard interface over blur city. Global business and technology internet connection. - Powered by AdobeServer room showing financial data processing and global network - Powered by AdobeData center with a blurred image of the data. Video of financial information server with realistic visualization. International commerce and financial management room with lifestyle interfaces. - Powered by AdobeVibrant digital data stream and analytics visualization with glowing blue and pink waves, representing modern technology and connectivity. generative ai - Powered by Adobe

Credit Photo

If you would like to credit the Photo, here are some ways you can do so

Free (free of charge)

Free for personal and commercial use.

Author: Awesome Content

Similar Free Stock Images

Financial Data Visualization Analysis on Black Background
Premium
row of illuminated data server racks in computer room with glowing text big data storage digital technology concept
Financial Data Analysis with Dynamic Graph on Blue Background
Digital Graph Across Urban Cityscape Enhancing Data Analytics
Futuristic Data Overlay on Modern Glass Building with Green Hues
Abstract Financial Data Analysis on Blue Background
Premium
Global data processing and financial market analysis
Digital Data Analysis with Rising Arrows on Black Background
Abstract Financial Stock Market Data Interface
Colorful Data Streams in Digital Interface
Financial Data Analysis with Charts and Graphs
Premium
Digital e-commerce shopping cart icon on a glowing blue futuristic circuit board cube, representing online retail technology, data processing and innovation concepts.
Abstract Financial Data Visualization with Analytics
Financial Data Overlays in Modern Office Workspace
Dynamic Financial Data Charts Histogram
Abstract Financial Charts with Colorful Holographic Effects
Premium
Abstract data visualization illustrating big data analytics and global financial markets
Financial Data Analysis with Chinese Flag Over Harbor
Financial Data Analytics Superimposed Over Computer Servers
Multi-Colored Charts Superimposed Over Urban Skyline
Digital Financial Data Overlay on Modern Office Environment
Premium
GPU-powered cryptocurrency mining rig glowing with LED lights while processing blockchain data streams.
Colorful Digital Data Processing Network Connections
Financial Data Processing in Digital Interface Concept
Abstract Urban Financial Data Visualization
Digital Interface Concept with Graphs and Media Icons
Premium
A high-tech control room with digital displays showcasing financial data and analytical insights. The image shows several monitors displaying graphs and charts, creating a dynamic visual
Futuristic Data Analytics and Digital Visualization on Technology Screen
Dynamic Financial Market Chart Display with Candlesticks
Futuristic Binary Data with Candlestick Chart Analysis
Multicolored Data Visualization on Wooden Desk for Insightful Analysis
Dynamic Digital Financial Data Visualization on Dark Background
Abstract Financial Data Background with Dynamic Charts
Premium
Digital Banking Security: A Futuristic Representation of Financial Technology with Glowing Blue Bank Building on a Circuit Board Background.
Cityscape with Dynamic Financial Data Virtual Visualization
Digital Data Processing Over Modern Glass Building
Abstract Digital Data Bars with Colorful Lines on Blue
Dynamic Data Visualization on Digital Interface
Premium
Data processing through interconnected computer servers, illustrating global finance and business connections
Dynamic Digital Stock Market Data Visualization
Ukrainian Flag with Financial Graphs Depicting Economic Crisis
Abstract Financial Data Analysis Conceptual Design
IT Engineer Analyzing Data with Digital Graphs on Computer Servers
Premium
Cryptocurrency mining hardware devices are processing transactions under red lights in a server room, symbolizing the intense activity and heat generated during the process
Dynamic Bars Overlapping Graph in Financial Analysis
Colorful Financial Data Visualization on Digital Grid
Data Analytics Overlaid on Modern Office Workspace
Dynamic Graphs over Empty Office Symbolize Business Progress
Premium
Businessman using laptop with AI and cloud data technology icons on dark background.
Digital Data Chart Visualization in Modern Office Environment
Financial Data Representation in Modern Office Context
Financial Data Analytics with Environmental Sustainability Icons
Digital Data Visualization with Abstract Bar Graphs
Premium
Analyzing financial data and code on digital interface
Financial Data Visualization Over Server Room
Digital Financial Data Processing with Futuristic Cityscape Background
Dynamic Financial Data Analytics with Global Technology Perspectives
Dynamic Data Visualization with Binary Matrix
Premium
Modern, dark server room aisle with endless rows of black racks displaying bright blue and green LED lights, representing cloud computing and big data storage
Dynamic Financial Trading Display with Neon Grid Pattern
Digital Financial Analysis Dashboard with Bar and Line Graphs
Digital Interface with Rising Bar Graphs and Trend Lines
Digital Financial Data and Market Trends Analysis on Black Background
Financial Data Processing Visualization with Colorful Bar Charts
Digital Data and Global Shipping Concept
Premium
A close-up view of a row of glowing cooling fans running on high-performance computing hardware in a data center.
Abstract Digital Data Flow on Modern Building Facade
Digital Data Visualization with Vibrant Bars and Lines on Blue
Digital Data Graphs with Blue Background and Light Flare
Abstract Data Visualization with Growing Charts
Premium
Blockchain data processing visualized in a high-tech server room with glowing blue cubes and holographic interface.
Futuristic Digital Grid with Data Visualization and Graphs
Colorful Financial Data Visualization with Statistical Graphs
Digital Data Interface on World Map Focusing Global Business Analytics
Dynamic Financial Data Analysis With Abstract Global Background
Premium
Data Center Servers Hosting Financial Market Data Visualizations for High-Frequency Trading and Analysis
Digital Financial Data Visualization with Bar Graphs and Line Charts
Data Visualization in Server Room with Graph Overlay
Abstract 3D Holographic Business Analytics on Black Background
Dynamic Data Display with Bars and Lines on Grid Background
Premium
Fintech AI Chip in Sustainable Cloud Technology Digital Power
Financial Data Visualization Overlaying Workspace
Dynamic Financing Data Visualization on Hungary Flag
Digital Data Processing with DNA Helix Overlay
Abstract Digital Connections over Data Graphics Network
Premium
Data center with a blurred image of the data. Video of financial information server with realistic visualization. International commerce and financial management lifestyle room with interfaces.
Business Data Processing and Digital Economy Concepts
Digital Data Analysis Over World Map with Graphs and Codes
Dynamic Financial Data Chart on Dark Digital Dashboard
Real-Time Financial Market Trends Visualization with Candlestick and Histogram
Premium
Digital Network System Architecture.
Colorful Data Visualization and Analytics Interface on Dark Grid
Pulsing neon audio spectrum with glowing equalizer bars over abstract light trails
Financial Data Charts in Blue Digital Interface Background
Vibrant Financial Data Analysis on Black Background
Dynamic Digital Data Integration with Urban Landscape
Dynamic Digital Data Visualization Over Modern Cityscape
Premium
Futuristic metallic 3D data cube structure symbolizing database management and cloud computing isolated on transparent background
Colorful Bar Charts and Arrows on Vivid Red Background
Digital Graph with Abstract Data on Blue Background
Dynamic Digital Financial Analysis with 3D Graphics
Abstract Digital Chart on Black Background Representing Data Analysis
Premium
A businessman's hand presents a futuristic digital interface, showcasing data processing and technological advancements in a modern, innovative concept.
Dynamic Financial Data Analysis with Interactive Charts and Graphs
Financial Data Processing Against Vibrant Cityscape Background
Dynamic Financial Data Analysis on Digital Platform
Digitally Generated Financial Data Over Server Room
Premium
A central computer on a wooden block connected to a network of file folder icons. Concept for a Document Management System (DMS), file sharing,file storage, data management,cloud storage.
Data Visualization Overlay in Dark Computer Server
Colorful Abstract Lines Overlapping Vibrant City Lights at Night
Colorful Graphical Data Analysis in Abstract Background
Complex Data Analytics Overlay in High-Tech Server Room
Premium
A cloud computing platform for enterprise business solutions. A central system for data storage, security, processing, and application hosting. Motif
Futuristic Digital Data Wave with Global Connections
Colorful Data Visualization with Technological Icon Elements
Caucasian IT Professional Analyzing Data in Server Room
Global Data Flow and Digital Interface on World Map
Premium
Futuristic data center with glowing servers and 3D financial chart overlay.
Digital Network Connections and Media Interface Elements
Urban Finance Data Visualization with Candlestick Chart Overlay
Colorful Candlestick Chart With Trend Lines on Digital Background
Digital Analytics Overlaid on Technology Infrastructure With Network Cables
Premium
High-tech diamond-shaped microchip in gold and blue, representing innovation, advanced computing, and data processing with a glowing halo
Displaying Neon Financial Candlestick and Bar Dashboard with Line Graphs and Halftone Grid