
- Home >
- Stock Photos >
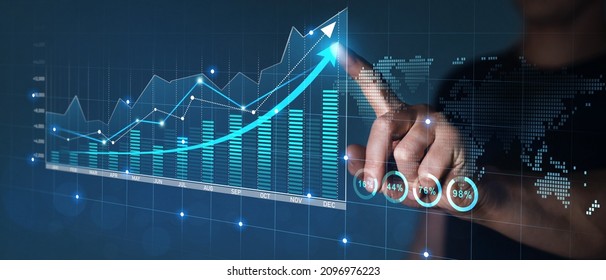
- Digital Financial Display with Graphs and Data Analysis
Digital Financial Display with Graphs and Data Analysis Image

Visual showcases a digital interface filled with financial graphs, charts, and statistical data analytics tailored for global finance and economic tracking. Useful for business technology presentations, educational materials on economic trends, or financial sector reports and websites.
Powered by  - Get 15% off with code: PIKWIZARD15


downloads
Tags:
More
Credit Photo
If you would like to credit the Photo, here are some ways you can do so
Text Link
photo Link
<span class="text-link">
<span>
<a target="_blank" href=https://pikwizard.com/photo/digital-financial-display-with-graphs-and-data-analysis/4dc8a2f6905398405069b051178134ea/>PikWizard</a>
</span>
</span>
<span class="image-link">
<span
style="margin: 0 0 20px 0; display: inline-block; vertical-align: middle; width: 100%;"
>
<a
target="_blank"
href="https://pikwizard.com/photo/digital-financial-display-with-graphs-and-data-analysis/4dc8a2f6905398405069b051178134ea/"
style="text-decoration: none; font-size: 10px; margin: 0;"
>
<img src="https://pikwizard.com/pw/medium/4dc8a2f6905398405069b051178134ea.jpg" style="margin: 0; width: 100%;" alt="" />
<p style="font-size: 12px; margin: 0;">PikWizard</p>
</a>
</span>
</span>
Free (free of charge)
Free for personal and commercial use.
Author: Creative Art
Similar Free Stock Images

Premium


Premium

Premium


Premium


Premium


Premium


Premium


Premium


Premium


Premium


Premium


Premium


Premium


Premium


Premium


Premium

Premium


Premium


Premium


Premium


Premium


Premium

Premium


Premium


Premium


Explore More Free Stock Images