1. Home > 
  2. Stock Photos > 
  3. Digital Financial Market Data with Peaks and Trends

Digital Financial Market Data with Peaks and Trends Image

Digital Financial Market Data with Peaks and Trends

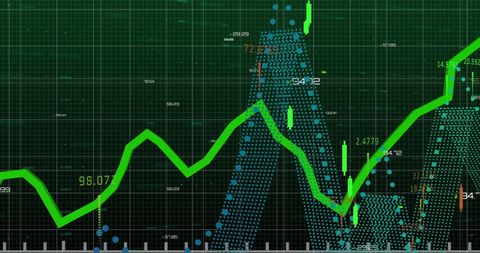
Ideal for depicting financial reports, market trends, or technology-focused presentations. Suitable for illustrating concepts of growth, analysis, and digital transformation in business and economics visualizations.

Powered by Shutterstock logo - Get 15% off with code: PIKWIZARD15
Stock market or forex trading graph in futuristic concept suitable for financial investment or Economic trends business idea and all art work design. Abstract finance background - Powered by Shutterstock - Get 15% off with code: PIKWIZARD15Business strategy development and growing growth plan.	
Financial management strategy for business growth.Graph and chart. Investment of growth on currency rate. - Powered by Shutterstock - Get 15% off with code: PIKWIZARD15hand show graph chart stock market economic. growth business concept. plan strategy company increase profit to success global. trend marketing grows technology digital. economy, financial, and invest - Powered by Shutterstock - Get 15% off with code: PIKWIZARD15Real estate, development and investing concept with financial chart indicators and stock market graphs on city skyscrapers tops bottom view, double exposure - Powered by Shutterstock - Get 15% off with code: PIKWIZARD15Businessman analyzing virtual graph chart on laptop screen. Concept of data analysis, financial growth, performance tracking, digital technology, and business intelligence. - Powered by Shutterstock - Get 15% off with code: PIKWIZARD15

Credit Photo

If you would like to credit the Photo, here are some ways you can do so

Free (free of charge)

Free for personal and commercial use.

Author: Creative Art

Similar Free Stock Images

Digital Data Processing Interface with Code and Graph
Premium
Electronic vehicle charging economic friendly sustainable efficient energy affecting rising economy market trending financial investment business industry, graphical chart and graph showing trend
Financial Data Charts with World Map on Blue Digital Background
Rising Digital Graph and Data Visualizations on Black Background
Digital Interface with Global Financial Graphs Background
Innovative Data Analysis with Dynamic Line Graph and Digital Elements
Premium
Stock market graph trading analysis investment financial, stock exchange financial or forex graph stock market graph chart business crisis crash loss and grow up gain and profits win up trend.
Financial Graph Analysis on Green Grid Background
Digital Data Network with Dynamic Connections
European Market Data Overlay with EU Flag and Financial Graphs
Dynamic Stock Market Graphs Over Digital Interface
Premium
Futuristic Digital Growth Chart – 3D Bar Graph with Glowing Blue Data Visualization
Rising Green Line Chart Overlays Concept of Financial Growth
Digital Finance Chart Overlaying Globe Background
Digital Data Visualization with Trend Lines and Percentage Changes
Colorful Data Visualization on Dark Background
Premium
Man look at the dashboard with graphs and charts. Concept of data management system, business intelligence, data statistics, marketing analysis, key performance indicators (KPI) and analytics.
Digital Simulated Global Financial Data and Graphs
Dynamic Green Line Graph Depicting Financial Data
Data Visualization on Security Shield Interface for Cyber Security
Binary Code Financial Analytics with Rising Graph Line
Premium
Digital economic growth chart with a rising trend towards 2025, symbolizing future market predictions.
Line Graph Illustrating Data Trend on Green Digital Background
Dynamic Red Line Graph With Data Points on Gridded Background
Financial Data Analysis with Futuristic Technology Interface
Analyzing Growing Graph Line on Purple Gradient Background
Premium
Forex trade market and development concept with growing digital candlestick and indicators on sunny skyscrapers background. Double exposure
Digital Stock Market Graph Red Trendline on Green Background
Futuristic Digital Graph Showing Data Trends on Analytic Interface
Futuristic Finance Dashboard with AI Technology and Data Visualization
Futuristic Data Visualization with Dynamic Graphs and Digital Globe
Digital Interface with Data Processing Visualization
Financial Graph and Cityscape Analysis with Technological Overlay
Premium
Stock market graph trading analysis investment financial, stock exchange financial or forex graph stock market graph chart business crisis crash loss and grow up gain and profits win up trend.
Futuristic Digital Interface with Spiraling Coding Patterns
Data Analytics and Financial Growth Indicators
Green Line Rising on Digital Trading Board with Abstract Background
Futuristic Graph and Data Visualization Interface Design
Premium
Abstract glowing big data forex candlestick chart on blurry city backdrop. Trade, technology, investment and analysis concept. Double exposure
Analyzing Data Trends on Digital Graph Interface
Digital Financial Data Graph Showcasing Market Trends
Growth Trend with Green Line Overlay and Modern Cityscape
Abstract Digital Finance Chart Showing Fluctuating Graph Lines
Premium
Finance analyst working on business analytics and data management system to make financial report with business performance, KPI dashboard. Corporate strategy for finance, digital marketing plan
Digital Financial Data and Global Market Analysis on Graph
Abstract Digital Data with Upward Trending Line Graph
Rising Graph Line on Digital Green Grid Background
Green Data Graph on Black Digital Interface
Premium
Stockmarket online trading chart candlestick on crypto currency platform. Stock exchange financial market price candles graph data pattern analysis concept. Computer screen closeup background
Declining Stock Market Graph with Red Trend Line
Cybersecurity Concept with Declining Data Graph and Digital Shield
Data Analysis Graphics on Digital Grid Background
Digital Graph Displaying Dynamic Data Analysis
Premium
Big Data Technology for Business Finance Analytic Concept. Modern graphic interface shows massive information of business sale report, profit chart and stock market trends analysis on screen monitor.
Green Line Graph with Data Points on Grid Background
Real-Time Financial Data Analysis with Graphs and Charts
Abstract Digital Data Graph and Diagrams on Gray Background
Green Line Graph on Dark Digital Grid
Premium
Businessman analyzes profitability of working companies with digital augmented reality graphics, positive indicators in 2023, businessman calculates financial data for long-term investments.
Digital Green Line Graph Over Grid with Statistics and Numbers
Futuristic Data Visualization Graph Vector Rising Trend
Futuristic Neon Green Data Visualization on Grid Background
Data Analysis Process with Green Digital Interface
Dynamic Financial Data Visualization over Urban Silhouette
Digital Financial Data Analyzing Over Circular Grid Display
Premium
Analysis finance grow graph and market  investment. Financial  business plan,earnings,sale and strategy. Stock market chart, exchange financial growth diagram.
Fluctuating Digital Stock Market Data Chart
Digital Data Analysis with Green Line Graph on Grid Background
Financial Data Line Graph on Digital Display
Data Trends and Analysis on 3D Digital Grid
Premium
Businessman analyzes profitability of working companies with digital augmented reality graphics, positive indicators in 2024, businessman calculates financial data for long-term investments.
Dynamic Green Line Graph Showing Financial Data Fluctuations
Data Analytics Graphs on Digital Interface Background
Dynamic Financial Data Visualizations on Grid Interface
Green Financial Line Chart Over Modern Office Buildings
Premium
graph stock market economics, chart growth business to success globally. concept of investment, plan strategy, increase profit, financial economy, and grow marketing. digital technology trend
Data Analysis with Advanced Technology Interface Details Profusion
Abstract Graph with Social Media Notification Icons and Data Points
Digital Data Processing Interface with Green Growth Chart
Financial Growth Chart with Dynamic Green Line on Grid Overlay
Premium
Night Singapore city skyscrapers. Forex financial rising graph and chart with bar diagrams that illustrate investment management on stock market. Concept of international internet trading
Binary Code and Financial Data on Digital Screen
Dynamic Financial Chart with Red Line Graph on Digital Interface
Dynamic Financial Graphs Overlaying Modern Cityscape
Digital Stock Market Graph with Abstract Coding Background
Premium
Stock market graph trading analysis investment financial, stock exchange financial or forex graph stock market graph chart business crisis crash loss and grow up gain and profits win up trend
Fluctuating Financial Graph on Green Grid Background
Abstract Representation of Financial Data Processing
Financial Growth Stock Nikkei in Urban City Skyline
Digital Financial Data Graph on Black Screen Background
Premium
Financial data in term of a digital prices on LED display. A number of daily market price and quotation of prices chart to represent candle stick tracking in Forex trading.
Advanced Digital Dashboard with Rising Bar and Line Charts
Candlestick Chart Visualization with Indicators and Growth Highlight
Digital Currency Trading Interface with Data Visualization
Global Economic Trends Highlighted on World Map with Graphs
Digital Financial Data Display with Graph and Grid
Digital Interface Showing Global Business Data Analytics
Premium
Business people analyze financial data chart trading forex, investing in stock markets, funds and digital assets, Business finance technology and investment concept, Business finance background.
Digital Financial Data Analysis with Growth Chart
Digital Financial Data with Graph and Grid Patterns
Cryptocurrency Growth Chart Over Digital World Map
Futuristic Financial Data Visualization on Digital Interface
Premium
Stock market or forex trading graph on touchscreen,  finance and investment concept. Economy trends for business, financial charts and digits.
Digital Fingerprint with Graph on Data Interface
Green Financial Line Graph with Candlestick Data on Grid Background
Digital Stock Market Green Graph Against Dark Trading Board
Digital Lock with Real-Time Data Display
Premium
Stock market chart, exchange financial growth diagram.Analysis finance grow graph and market investment. Financial business plan,earnings,sale and strategy.
Rising Financial Data Graph on Digital Grid Background
Dynamic Data Chart on Dark Digital Background
Digital Data Prozessing with Global Interface Design
Digital Graph with Rising and Falling Lines on Grid Background
Premium
Analyzing Key Performance Indicators. Businessman using digital screen to analyze key performance indicators (KPI) with various graphs and charts, showcasing data analysis and performance tracking.
NFT Financial Data Visualization with Digital Graph Overlay
Cityscape with Digital Stock Market Graphs and Statistics
Green Line Graph Overlapping Data Server Racks in Technology Center
Green Graph Showing Forex Trends on Transparent Cyber Interface
Premium
Close up of hand pointing at glowing business chart on dark blue background. Stock, market and trade concept. Double exposure
Digital Data Processing with Graph and Grid Technology Interface
Digital Graphs and Data Visualization on Green Background
Futuristic Digital Representation of DNA Strand
Digital Financial Chart with Green Trend Line on Grid Background
Premium
Stock market graph trading analysis investment financial, stock exchange financial or forex graph stock market graph chart business crisis crash loss and grow up gain and profits win up trend
Dynamic Line Chart Representing Financial Data Growth