- Home >
- Stock Photos >
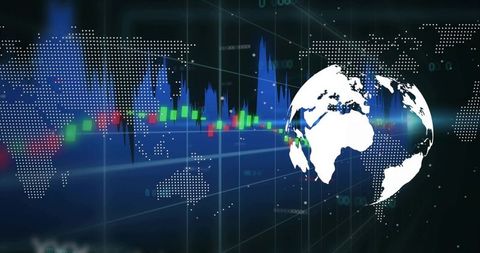
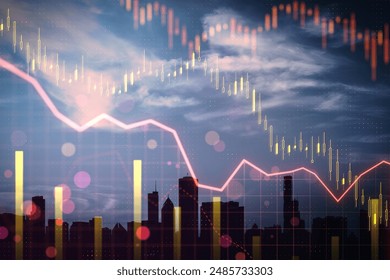
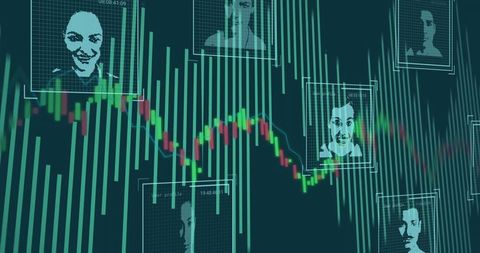
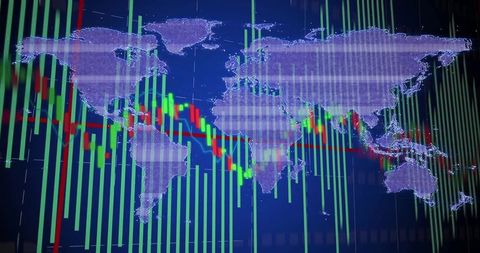
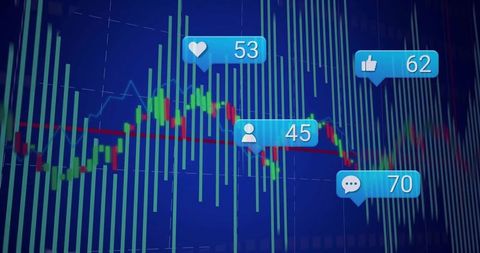
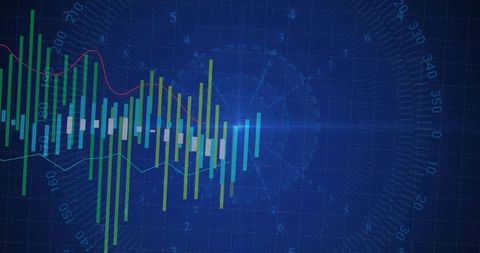
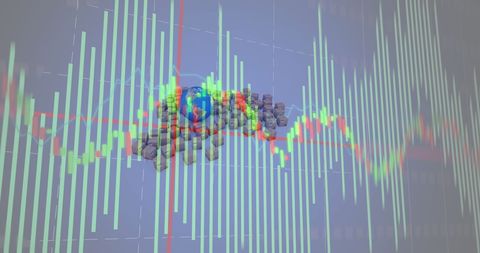
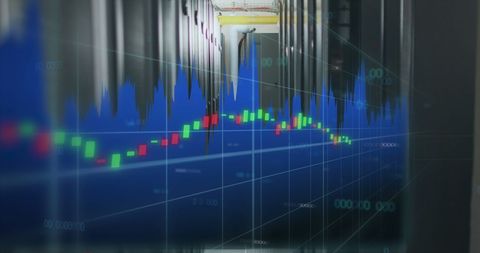
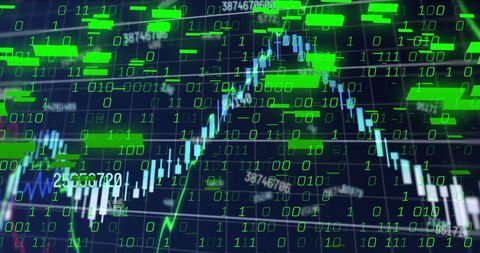
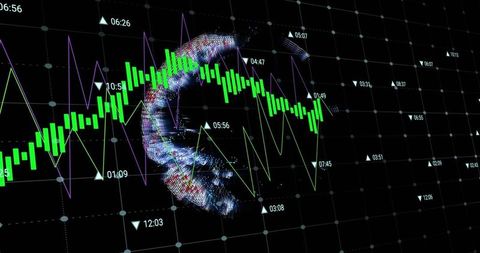
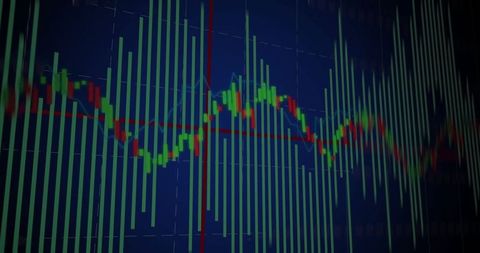
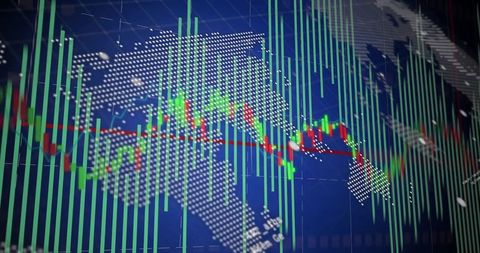
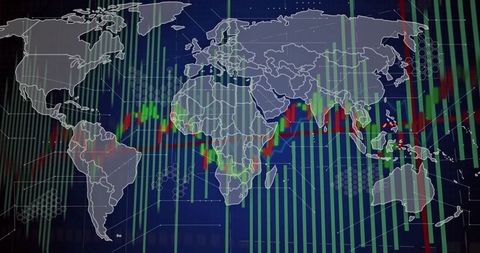
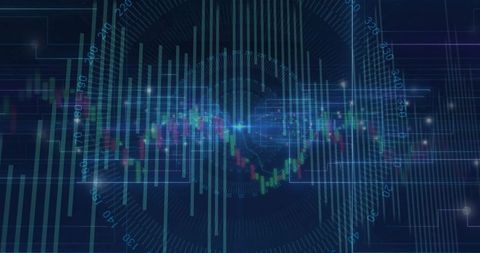
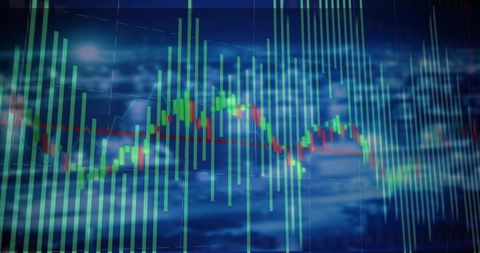
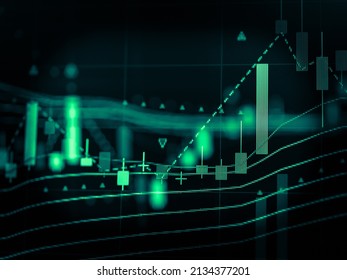
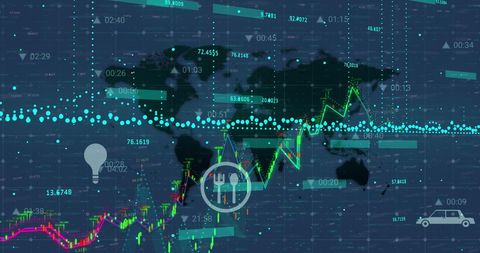
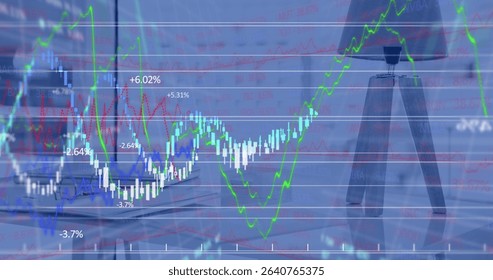
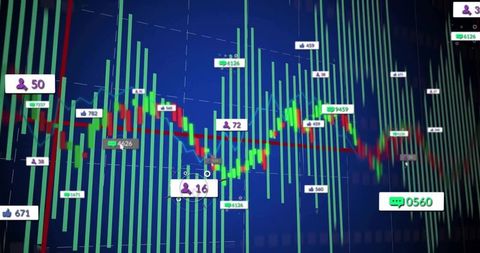
- Digital Financial Market Trends with Business Analytics
Digital Financial Market Trends with Business Analytics Image
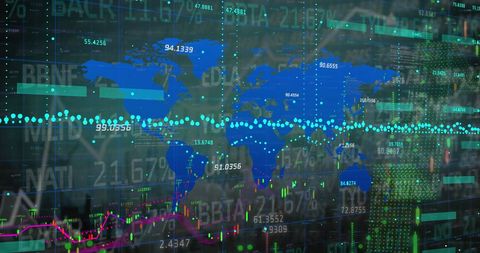
Image depicts globe and digital financial indicators including candlestick bars and trend lines for illustrating market dynamics and economic trends. Useful for articles, presentations or reports related to stock market analysis, investment opportunities, technology integration in finance, and economic trends. Ideal as a background for financial seminars, data analytics workshops, or investment consultancy social media.
Powered by  - Get 15% off with code: PIKWIZARD15


0
downloads
downloads
Tags:
More
Credit Photo
If you would like to credit the Photo, here are some ways you can do so
Text Link
photo Link
<span class="text-link">
<span>
<a target="_blank" href=https://pikwizard.com/photo/digital-financial-market-trends-with-business-analytics/899d988a6fe053147d9f3701a43fd179/>PikWizard</a>
</span>
</span>
<span class="image-link">
<span
style="margin: 0 0 20px 0; display: inline-block; vertical-align: middle; width: 100%;"
>
<a
target="_blank"
href="https://pikwizard.com/photo/digital-financial-market-trends-with-business-analytics/899d988a6fe053147d9f3701a43fd179/"
style="text-decoration: none; font-size: 10px; margin: 0;"
>
<img src="https://pikwizard.com/pw/medium/899d988a6fe053147d9f3701a43fd179.jpg" style="margin: 0; width: 100%;" alt="" />
<p style="font-size: 12px; margin: 0;">PikWizard</p>
</a>
</span>
</span>
Free (free of charge)
Free for personal and commercial use.
Author: Creative Art
Similar Free Stock Images
Premium


Premium


Premium


Premium


Premium


Premium


Premium
Premium


Premium


Premium


Premium


Premium


Premium


Premium


Premium


Premium

Premium


Premium

Premium


Premium


Premium


Premium


Premium


Premium


Premium