
- Home >
- Stock Photos >
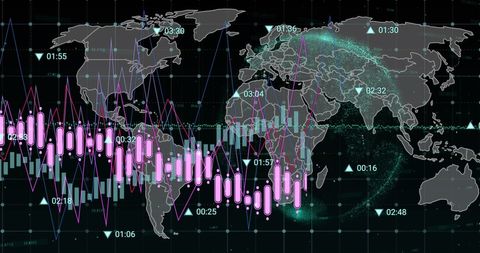
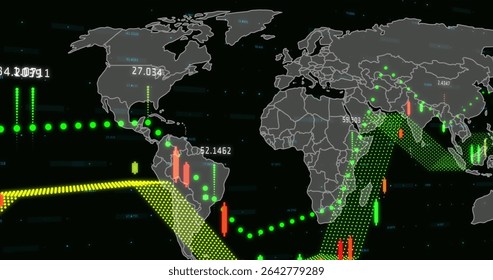
- Digital Global Dashboard with Bar Chart and Data Visualization
Digital Global Dashboard with Bar Chart and Data Visualization Image

This striking image features a digital dashboard that brings together a global map with a prominent vertical bar chart. Ideal for themes focusing on data analytics, finance, and technology trends, it serves as a visual representation of modern insight and monitoring systems. Useful for corporate presentations, financial reports, and technology conference materials.
Powered by  - Get 15% off with code: PIKWIZARD15


downloads
Tags:
More
Credit Photo
If you would like to credit the Photo, here are some ways you can do so
Text Link
photo Link
<span class="text-link">
<span>
<a target="_blank" href=https://pikwizard.com/photo/digital-global-dashboard-with-bar-chart-and-data-visualization/342df2a44e4689e4b3d86cc63387fc5b/>PikWizard</a>
</span>
</span>
<span class="image-link">
<span
style="margin: 0 0 20px 0; display: inline-block; vertical-align: middle; width: 100%;"
>
<a
target="_blank"
href="https://pikwizard.com/photo/digital-global-dashboard-with-bar-chart-and-data-visualization/342df2a44e4689e4b3d86cc63387fc5b/"
style="text-decoration: none; font-size: 10px; margin: 0;"
>
<img src="https://pikwizard.com/pw/medium/342df2a44e4689e4b3d86cc63387fc5b.jpg" style="margin: 0; width: 100%;" alt="" />
<p style="font-size: 12px; margin: 0;">PikWizard</p>
</a>
</span>
</span>
Free (free of charge)
Free for personal and commercial use.
Author: Creative Art
Similar Free Stock Images

Premium


Premium

Premium


Premium


Premium


Premium


Premium


Premium

Premium
Premium

Premium


Premium


Premium


Premium


Premium


Premium


Premium


Premium


Premium


Premium


Premium
Premium


Premium


Premium


Premium


Explore More Free Stock Images