1. Home > 
  2. Stock Photos > 
  3. Digital Graph Display with Dynamic Data Visualization on Black Background

Digital Graph Display with Dynamic Data Visualization on Black Background Image

Digital Graph Display with Dynamic Data Visualization on Black Background

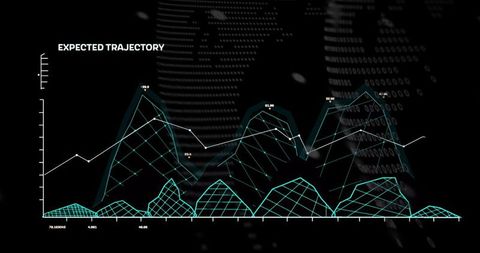
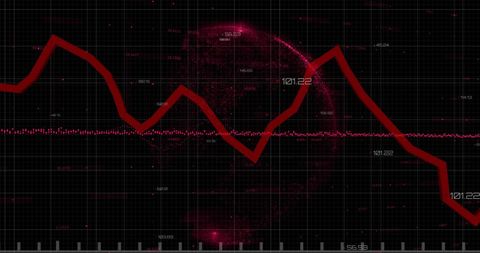
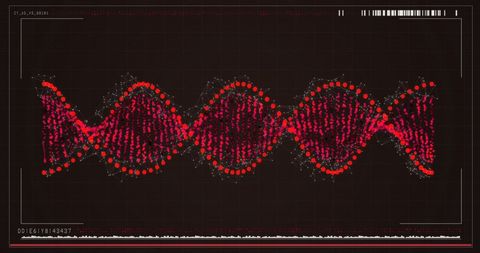
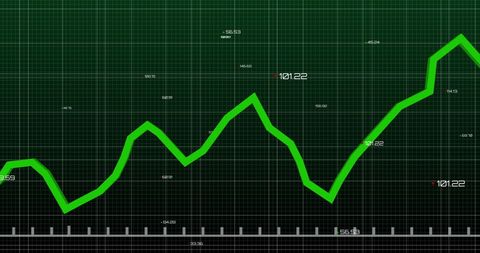
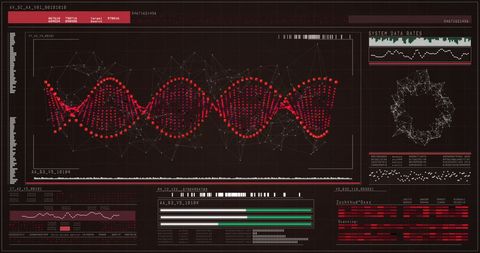
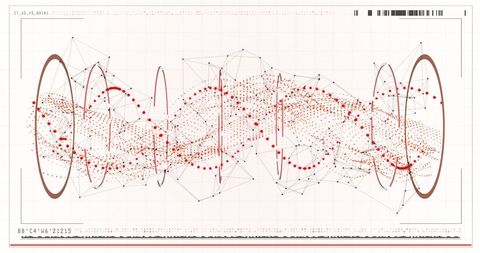
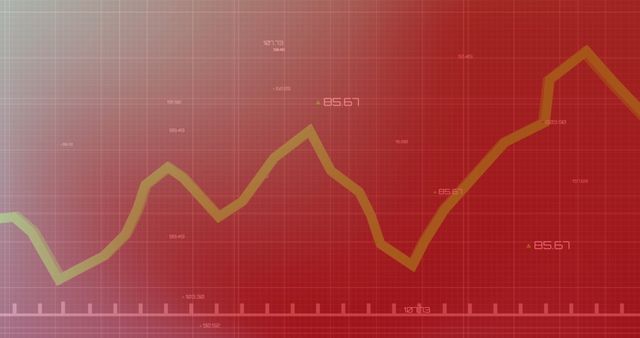
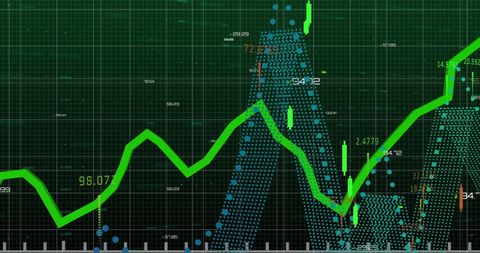
Graph element showcasing projected data trends on an electronic display. Grid lines and bar charts illustrate potential growth and fluctuation targets. Perfect for websites, presentations, corporate dossiers discussing financial trends or technological advancements. Suitable for use in tech-themed products, and media relating presentation on strategic business insights. Also applicable in footage meant for computer-related intros or thematic background imagery.

Powered by Shutterstock logo - Get 15% off with code: PIKWIZARD15
Businessman using laptop computer analyzing sales data and financial growth graph chart report. Business planning, strategy and development. Financial accounting. market research, data analysis - Powered by Shutterstock - Get 15% off with code: PIKWIZARD15Big data technology and data science. Data scientist querying, analysing and visualizing complex set on virtual screen. Data flow concept. Neural network, artificial intelligence, ML, analytics. - Powered by Shutterstock - Get 15% off with code: PIKWIZARD15Analyzing Key Performance Indicators. Businessman using digital screen to analyze key performance indicators (KPI) with various graphs and charts, showcasing data analysis and performance tracking. - Powered by Shutterstock - Get 15% off with code: PIKWIZARD15Analyst working with Business, Concept digital transformation technology strategy, Analytics and Data Management System on computer, make a report with KPI and metrics connected to database. - Powered by Shutterstock - Get 15% off with code: PIKWIZARD15AI, Big Data, and business analytics icons represent the integration of advanced technology in analyzing graphs, business data, and market trends, driving strategic decisions and innovative solutions. - Powered by Shutterstock - Get 15% off with code: PIKWIZARD15

Credit Photo

If you would like to credit the Photo, here are some ways you can do so

Free (free of charge)

Free for personal and commercial use.

Author: Awesome Content

Similar Free Stock Images

Dynamic Digital Finance Chart with Green Line on Grid
Premium
Dashboard finance management on laptop computer analyzing sales data and growth graph chart report. Business planning, strategy and development. Financial accounting. market research, data analysis
High-Tech Digital DNA Structure Visualization
Digital DNA with Red Matrix Elements on Dark Background
Abstract DNA Helix Digital Network
Futuristic Data Visualization Chart with Digital Mountain Peaks
Premium
beautiful abstract wave technology background with blue light, digital wave effect, corporate concept
Digital Data Visualization with World Map and Graphs
Digital Finance: Modern Stock Market Analysis Display
Innovative Data Analysis with Dynamic Line Graph and Digital Elements
Digital Financial Data with Graph and Grid Patterns
Premium
KPI data analytics concept, Key performance indicator analysis system. Information technology digital software management. Visualization tech solution. Business artificial intelligence. AI dashboard.
Analyzing Data Trends on Digital Graph Interface
Futuristic Financial Data Visualization on Digital Interface
Dynamic Business Data and Cityscape Visualization
Cryptocurrency Trends and Data Visualization Concept
Premium
Modern highway aerial view and various charts. Transportation and technology concept. ITS (Intelligent Transport Systems). Mobility as a service.
Data Visualization on Security Shield Interface for Cyber Security
Financial Data Processing with Digital Network Connections
Financial Data Graph Over Cityscape with Digital Overlay
Digital Financial Graphs Over 3D City Model Illustration
Premium
A hand interacts with glowing holographic data graphs and charts, showcasing futuristic digital visualization on a dark background. Concept of innovation
Dynamic Stock Market Graph with ECO Icons
Abstract Representation of Financial Data Processing
World Map with Digital Data Stream and Processing Interface
Abstract Digital DNA Helix with Geometric Patterns and Nodes
Premium
Woman hold smartphone use pc at workplace. Project stats financial data sales charts on laptop and cellphone screen, close up view over shoulder. Report preparation, synchronization for safety concept
Digital Security In Financial Analytics Showing Data Chart and Padlock
Abstract Data Network with Red Nodes and Brown Rings
Abstract Data Visualization with Circular Markers and Numeric Labels
Futuristic Waveform Data Visualization on Digital Grid
Global Market Downtrend with Red Graph Line Illustration
Digital Financial Data Chart with Modern City Skyscrapers
Premium
Man look at the dashboard with graphs and charts. Concept of data management system, business intelligence, data statistics, marketing analysis, key performance indicators (KPI) and analytics.
Abstract DNA Sequence and Data Interface
Digital Data Processing with Scope Scanning Interface
Financial Data Graph Rendering Global Market Trends
Falling Line Graph on Navy Background Illustrating Economic Decline
Premium
Professional data analyst using data visualizations dashboard on computer monitor for data business analysis and Data Management System
Digital Financial Display with Graphs and Data Analysis
Digital Data Analysis with Green Line Graph on Grid Background
Data Security with Tech Bar Graph Overlay
Digital Financial Data Analysis with Graphs and Stock Market Trends
Premium
Business marketing and product development concepts with customer relationship management system and enterprise resource planning.Strategic planning and data analysis
Digital Financial Data Graph Showcasing Market Trends
Digital Data Visualization with Trend Lines and Percentage Changes
Colorful Bar Graph with Data Overlay on Black Background
Dynamic Financial Data Visualization on Digital Grid Background
Premium
Businessman analyzing financial, fund, account data from growing investments. Virtual graph reporting using digital technology. Man touching tablet at working room. Business finance growth concept.
Data Analytics Graph with Redline Trends on Grid Background
Digital Financial Market Data with Peaks and Trends
Digital Cityscape with Financial Data Overlay
Futuristic Dashboard Interface with Digital Hologram and Coding Elements
Premium
Conceptual visual of data analysis with black woman working in the office
Financial Graph with Data Analysis and Market Statistics
Digital Interface Visualizing DNA and Data Patterns
Futuristic Digital Graph Showing Data Trends on Analytic Interface
Digital DNA and Brain Data Interface Display in Dark Theme
Premium
Hand using stylus on tablet with futuristic digital analytics interface, glowing data visualizations, charts, and graphs, technology concept
Futuristic Analytics Graph with Cyan-Orange Line Trends
Neon Waveform on World Map with Futuristic Data Visuals
Futuristic Neon Green Data Visualization on Grid Background
Digital Finance Data Overlaying Futuristic Cityscape
Global Financial Data Analytics with Digital Globe and Red Graph Lines
Abstract Digital DNA Strand on Dark Background
Premium
Man look at the dashboard with graphs and charts. Concept of data management system, business intelligence, data statistics, marketing analysis, key performance indicators (KPI) and analytics.
Futuristic Data Visualization on Black Background
Financial Data Flow against Urban Skyline Backdrop
Rising Digital Graph and Data Visualizations on Black Background
Digital Interface Showing Global Business Data Analytics
Premium
AI, Big Data, and business analytics icons represent the integration of advanced technology in analyzing graphs, business data, and market trends, driving strategic decisions and innovative solutions.
Futuristic Graph and Data Visualization Interface Design
Futuristic Graph with Digital Globe Symbolizing Global Technology Connections
Dynamic Financial Charts and Graphs Indicating Market Trends
Social Media Activity Icons on Digital Graph
Premium
Hand holding smartphone displays data visualizations, including histogram and pie chart. Analytics, digital transformation and increasing use of mobile technology in business. Minimalist art collage.
Data Analysis with Advanced Technology Interface Details Profusion
Rising Graph Line on Digital Green Grid Background
Digital Data Processing Interface with Green Growth Chart
Digital Data Flow with Infographics Hologram
Premium
Professional data analyst using data visualizations dashboard on computer monitor for data business analysis and Data Management System
Dynamic Financial Graph with Rising Stock Data
NFT Financial Data Visualization with Digital Graph Overlay
Dynamic Red Line Graph With Data Points on Gridded Background
Dynamic Financial Data Overlaid on Grid Background
Premium
Data driven concept with businessman use virtual touchscreens with data in graphs and trends to make decisions and implement marketing strategies to reach more customers
Futuristic Digital Representation of DNA Strand
Digital Visualization of Global Networking with Statistical Graphs
Digital Data Processing with Chart in Futuristic Interface
Futuristic Data Dashboard with Abstract Waveforms and Light Effects
Premium
Professional Using AI-Powered Laptop and Smartphone to Analyze Data Insights and Marketing Analytics with Holographic Graphs and Infographics, Showcasing Advanced Technology and Future Digital
Futuristic Data Visualization with Dynamic Graphs and Digital Globe
Candlestick Chart Visualization with Indicators and Growth Highlight
Abstract Finance Graph Over 3D Cityscape Background
Futuristic Stock Market Data with Mathematical Formulas
Abstract Digital DNA Structure Visualization
Graph Lines Portraying Financial Data Trends
Premium
Big data technology and data science. Data scientist querying, analysing and visualizing complex information on virtual screen. Data flow concept. Business analytics, finance, neural network, AI, ML.
Dynamic Line Chart with Histogram on Digital Grid Background
Futuristic Digital Interface with Spiraling Coding Patterns
Digital Interface with Global Financial Graphs Background
Fluctuating Digital Stock Market Data Chart
Premium
Data science. Man programmer using digital tablet computer analyzing and develop software on futuristic virtual interface screen. Algorithm, big data analysis and management, data visualization
Dynamic Data Graphs on Digital Interface Background
Digital Data Network with Dynamic Connections
Financial Data Processing with Digital Patterns for Global Business
Data Analytics Graphs on Digital Interface Background
Premium
Businessman analyze and visualize complex information on a virtual screen using AI to process data. Big data technology and data science.Data flow.Digital neural network.artificial intelligence
Rising Financial Data Graph on Digital Grid Background
Dynamic Green Line Graph Depicting Financial Data
Dynamic Stock Market Chart with Time Indicators and Data Trends
Dynamic Stock Market Data Chart with Trend Line
Premium
Display of quotes pricing graph visualization.  Financial statistic analysis on dark background with growing financial charts. Stock analyzing. Price chart bars.
Analyzing Financial Data on Digital World Map Background
Green Line Graph with Data Points on Grid Background
Fluctuating Financial Graph on Green Grid Background
Green Line Graph on Dark Digital Grid
Premium
Data center and digital technology concept. Communication network. Science technology. Wide angle visual for banners or advertisements.
Digital Green Line Graph Over Grid with Statistics and Numbers
Abstract Data Visualization with Technological Grid Background
Abstract Neon Digital Waveform on Futuristic Network Background
Dynamic 3D Renewable Energy and Finance Data Analysis
Premium
business analytics and financial technology concept, 3d chart from the screen of digital tablet computer
Dynamic Line Chart Representing Financial Data Growth