1. Home > 
  2. Stock Photos > 
  3. Digital Graphs and Charts on Tech Background Illustrating Data Analysis

Digital Graphs and Charts on Tech Background Illustrating Data Analysis Image

Digital Graphs and Charts on Tech Background Illustrating Data Analysis

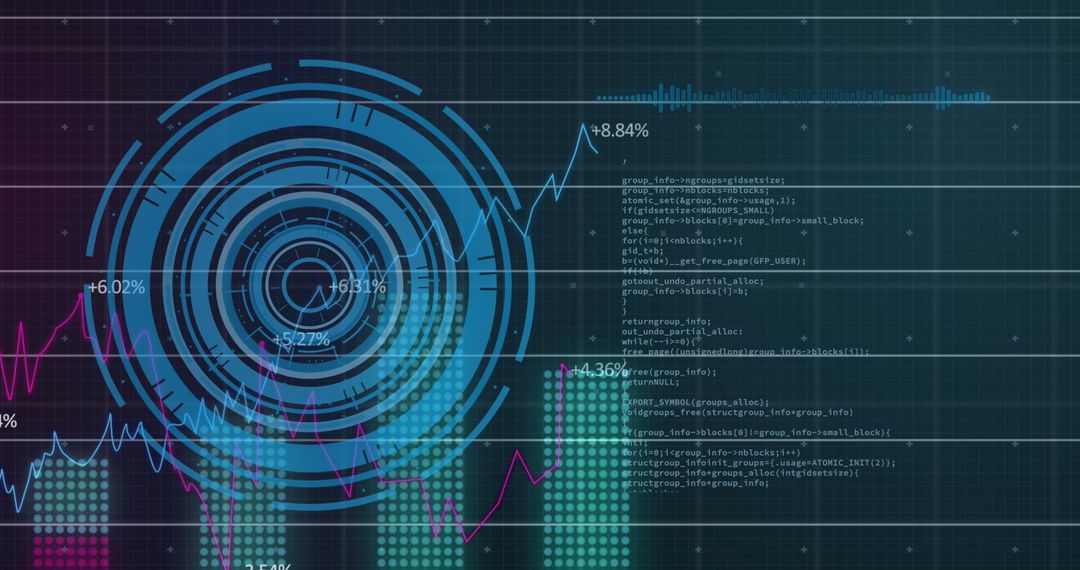
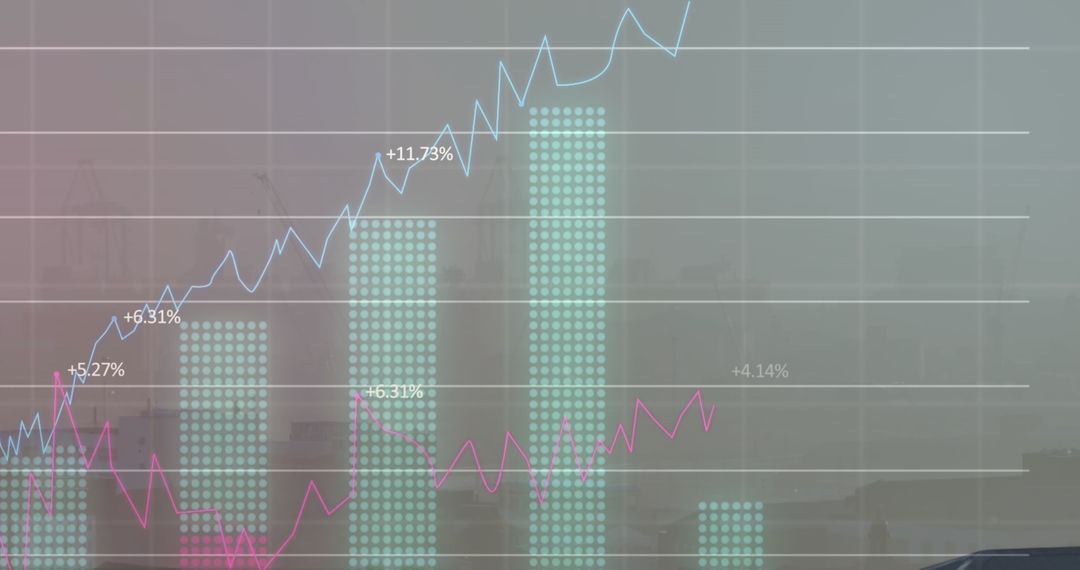
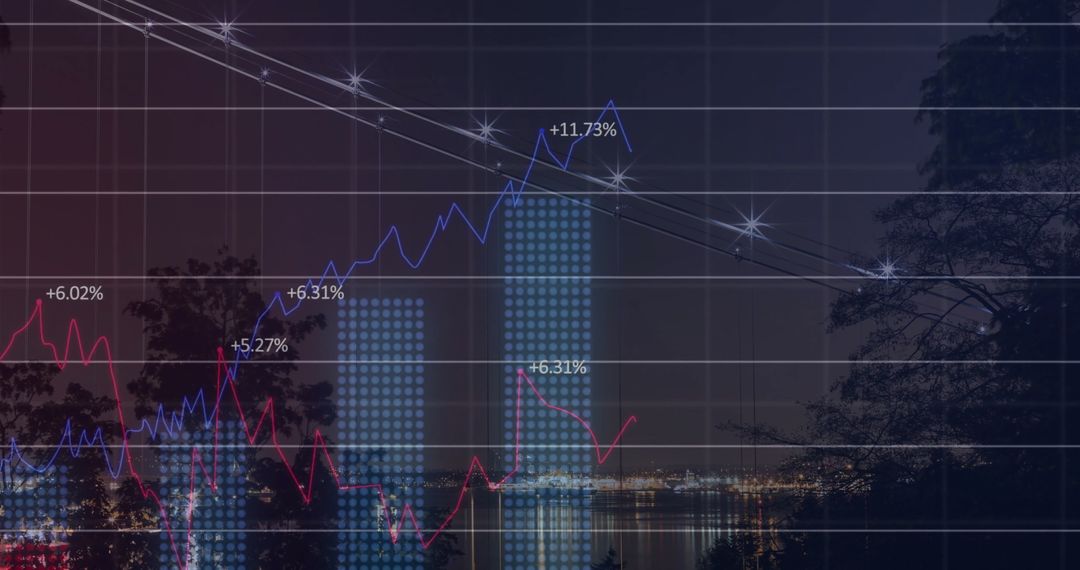
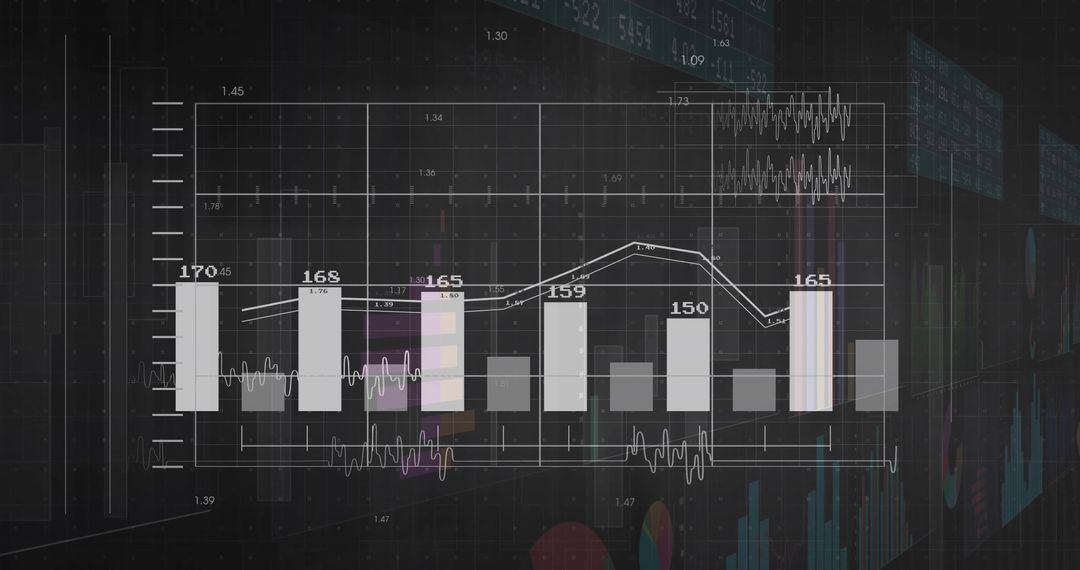
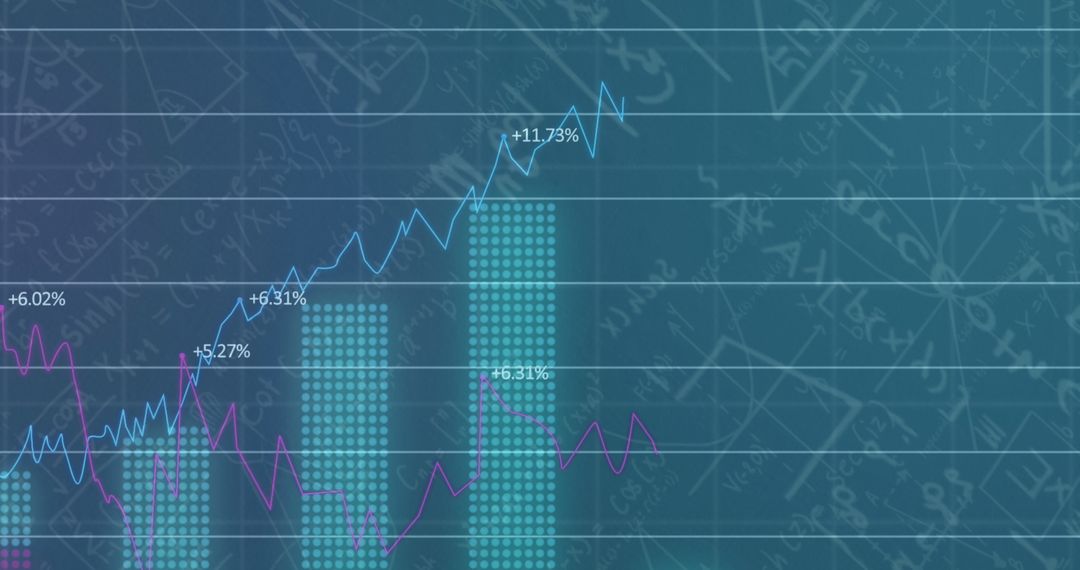
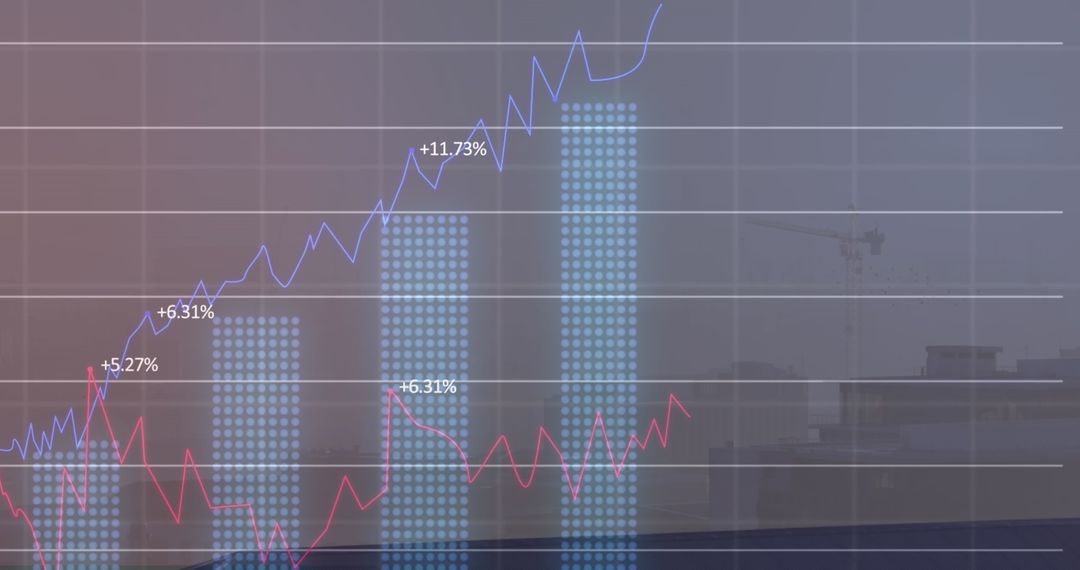
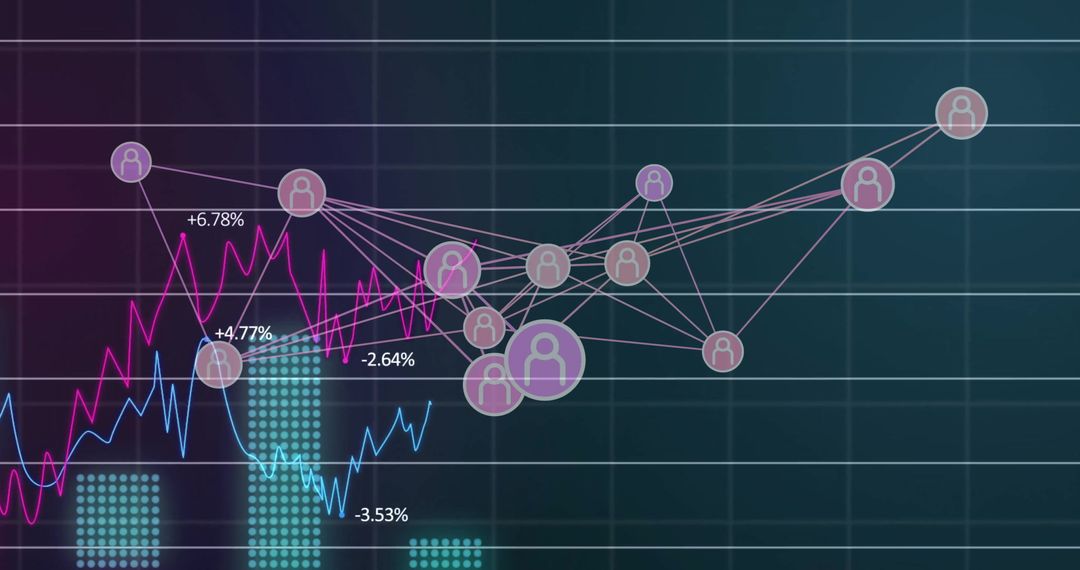
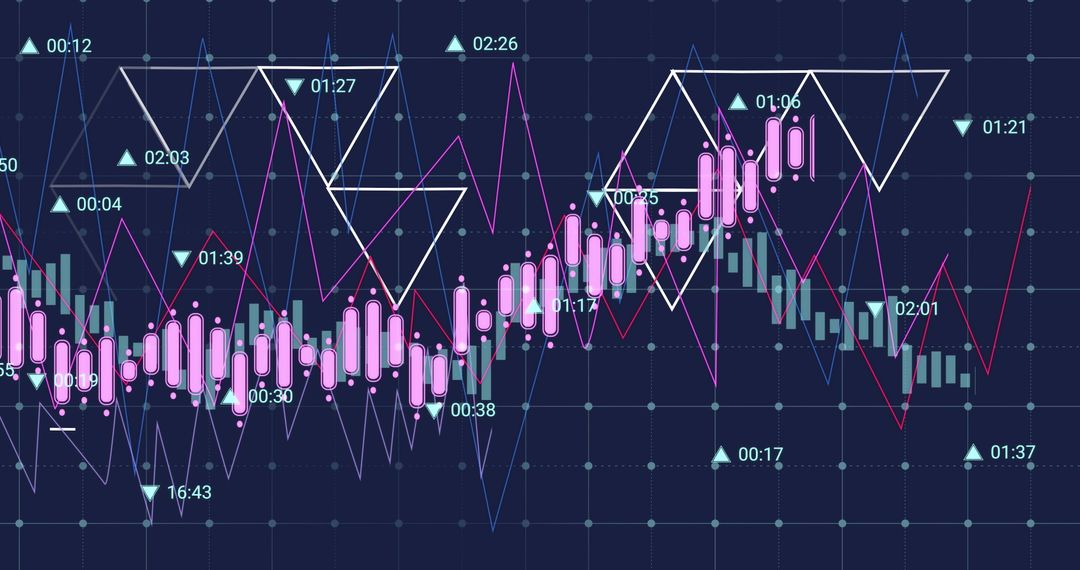
This visual of digital graphs and rising statistics exemplifies modern data analysis, often utilized in finance and business settings to depict trends or results. Ideal for illustrating articles or presentations about stock market developments, innovative tech solutions, or strategies in digital business.

Powered by Adobe logo
Businessman analyzing financial data on futuristic digital screen with graphs and charts on a dark background, showcasing the finance growth concept. - Powered by AdobeConfident young African descent finance advisor analyzing data trends on digital device in office - Powered by AdobeYoung businessman presenting performance data to senior businessman on a large screen - Powered by AdobeA businessman analyzes rising inflation data through digital charts and graphs displayed over a cityscape background. - Powered by AdobeA diverse group of professionals attentively listens as a confident speaker presents data on a digital display during a productive business meeting. - Powered by Adobe

Credit Photo

If you would like to credit the Photo, here are some ways you can do so

Free (free of charge)

Free for personal and commercial use.

Author: Awesome Content

Similar Free Stock Images

Digital Graphs Displaying Financial Data Analysis in Blue
Premium
Data analysis Holographic projection showing graphs and charts on tablet with cityscape in background modern technology concept
Global Financial Markets and Technology Analysis
Digital Stock Market Data and Analytics on Screen
Financial Growth Chart Displaying Performance Trends
Digital Interface with Data Sharing and Connection Network
Premium
Businessman analyzing financial market data on a digital screen with a pen and stock charts in a high-tech office environment for investment and trading analysis
Diverse Graphs and Data Over Urban Landscape
Futuristic Financial and Technological Data Visualization Concept
Rising Financial Graph on Purple Background
Dynamic Statistical Data Over Grid Network Isolated on White
Premium
Ai generated image of laptop displaying financial data analysis charts and graphs isolated on transparent background
Digital Financial Graph Illustrating Stock Market Trends
Financial Data Analysis with Graph and Connectivity
Data Analytics with Dynamic Global Market Trends on Screen
Statistical Graphs Over Cityscape Highlighting Business Growth
Premium
Man types on laptop with data charts and graphs overlay for business analysis
Digital Fingerprint Overlayed on Financial Data Illustrating Cybersecurity
Visuals Exploring Business Analytics and Digital Connectivity
Futuristic Financial Data Interface with Graphs and Binary Code
Networked Financial Data Analytics with People Icons
Premium
Business people analyzing financial data on digital tablet and laptop. Business team analyzing financial data on digital device in office, discussing strategy for growth and success.
Dynamic Financial Growth Chart with Digital Data Streams
Digital Data Analytics Growth Trend with Graphs
Financial Data Analysis with Graphs and Charts on Dark Background
Financial Data and Cityscape at Night with Rising Graph
Premium
Futuristic digital dashboard displaying complex data and analytics
Dynamic Financial Graph Displaying Market Trends
Social Media Metrics Dashboard with Interactive Graphs
Digital Financial Chart with Line plots and Bar Columns
Cybersecurity Dashboard With Data and Code Elements Display
Global Financial Data with World Map and Statistics
Abstract Digital Finance Graph Interface Display
Premium
Business intelligence analyst dashboard on virtual screen. Big data Graphs Charts.
Futuristic Digital Financial Network and Economic Growth
Dynamic Graphs and Digital Networks Overlay
Data Processing and Cloud Computing Server Room Visualization
Financial Data Analysis Graph with Growing Trends
Premium
Planning, meeting and man with team on tablet for graph, kpi research or data analysis. Presentation, digital agency and workers on tech with charts, documents or statistics for seo report on screen
Eco Data Visualization with Environmental Icons and Graphs
Graph Showing Stock Market Activity and Financial Data Analysis
Dynamic Data Visualization with Financial Charts and 3D Elements
Stock Market Trends and Data Analysis over Digital Grid
Premium
Marketing team analyzing data and collaborating on laptop in office meeting
Financial Data and Graphs with Futuristic Interface
Financial Data Visualization with Growing Business Charts
Stock Market Analysis Digital Screen with Graphs and Trends
Digital Cityscape with Financial Data Overlay
Premium
A man in a suit interacting with a futuristic holographic interface with data charts
Digital Financial Data Analysis and Stock Market Charting
Dynamic Stock Market Graph with Percentage Indicators
Financial Growth Chart with Digital Data Interface
Innovative Digital Finance Data Display on Dark Interface
Premium
Dynamic team collaborates on futuristic holographic data analysis in modern office at sunset
Data Analytics with Digital Graphs and Charts on Dark Background
Global Financial Analytics on Digital World Map
Futuristic Financial Data Analysis with Graphs and Charts
Global Currency Symbols and Financial Network Graph
Premium
Data Analysis of DNA: A close-up shot of a computer monitor displaying complex DNA strands, intricate charts and graphs, symbolizing the cutting-edge of medical research and innovation.
Financial Analytics Dashboard with Growth Trends and Indicators
Financial Charts with Blue and Red Lines and Digital Percent Indicators
Neon Analytics Dashboard Showing Rising Blue Trend Line, Red Volatility, Dotted Bars
Digital Financial Data Stream with Numeric Overlay
Data Processing and Statistics Visualization in Server Room
Healthcare and Finance Synergy with Data Visualization
Premium
A man analyzes multiple digital data dashboards displaying charts and graphs, immersed in a high-tech control room environment.
Digital Data Interface on World Map Focusing Global Business Analytics
Dynamic Digital Interface for Data Analysis and Statistics
Abstract Financial Data Visualization with Global Connections
Dynamic Stock Market Graphics on Modern Digital Interface
Premium
Data analyst works at modern office digital workspace analyzing charts on multiple computer screens. Focused view shows productivity, insights, and business intelligence in tech environment.
Financial Growth Graph and Data Analytics Representation
Stock Market Data Visuals Displaying Financial Analysis Trends
Rising Data Trends on Gradient Graph with Business Insights
Digital Data Analytics Showing Bar Graph and Curves on Black Background
Premium
Businessman tablet analysis data charts graphs hotel reception desk teamwork collaboration suit tie
Financial Data Processing with Digital Graph Overlay
Analyzing Business Growth with Architectural Backdrop
Abstract Global Network with Dynamic Graphs
Financial Growth Chart Over Urban Cityscape, Business Data Concept
Premium
Laptop screen displaying financial charts
Dynamic Data Analytics Interface Showing Statistical Trends
Dynamic Financial Data with Global Connections and Insights
Data Processing Overlaid on Graphs and Code in Digital Interface
Digital Projection of Financial Data with Bar Graphs
Premium
A business professional scrutinizes financial data on a keyboard, with digital graphs illuminating stock market trends and analysis in a modern office environment. Scalp
Financial Stock Market Trends Over Digital Grid Background
Analyzing Financial Data with Global Trends and Charts
Financial Data Processing with Graphs and Charts Background
Dynamic Financial Data Analytics with Stock Market Trends
Premium
Person holding a smartphone displaying a financial dashboard with charts and graphs in a modern office setting
Red Arrow Indicating Upward Trend in Financial Graphs
Global Market Dashboard Showing 3D Bar Charts, Trend Lines and Currency Performance
Digital Financial Data and Dynamic Stock Market Graphs
Digital Stock Market Trends and Financial Growth Analysis
Abstract Digital Interface with Connected Network Segments
Digital Financial Data Display with Graphs and Analytics
Premium
Businessman analyzing interactive analytics dashboard showing bar charts pie charts KPI graphs visual data reports performance metrics digital technology smart finance strategic tools
Rising Financial Graphs with Digital Data Interface
Digital Data with Financial Graphs on Global Grid
Rising Graphs and Interactive Financial Data Analytics Background
Eco-Friendly Icons Overlaid on Rising Stock Market Graph
Premium
representation of data analytics charts graphs and data driven insights emerging from a sea of information
Financial Data Visualization with Urban Nightscape
Digital Visualization Financial Data Growth Progressive Graph
Digital Network Connections with Financial Data Visualization
Futuristic Data Recovery Concept on Digital Interface
Premium
Landscape of wind turbines in green field with digital overlay energy data and charts - renewable energy technology and data analysis for sustainable power concept
Dynamic Financial Graphs Illustrating Business Growth
Digital Fingerprint with Data Overlay on Futuristic Interface
Futuristic Financial Data Display with Stock Market Analysis
Global Financial Data Processing with Digital Interface Elements
Premium
Financial market data analysis with glowing 3D bar and line charts on dark background showing economic trends and growth concept visualization. 3D Rendering
Futuristic Financial Data Visualization Chart and Global Analytics
Digital Financial Graphs and Business Analytics on Blue Backdrop
Financial Data Visualizations and Analytics on Dark Background
Digital Financial Graphs and Data Analysis Visualization
Premium
Man analyzing financial data on multiple screens
Dynamic Financial Data with Fluctuating Graph Lines
Dynamic Digital Interface Displaying Financial Data Analysis
Digital Financial Chart with Candlesticks and Line Graphs for Market Analysis
Financial Growth Represented by Upward Trending Digital Chart
Premium
Typing on a glowing laptop with emerging data graphs for business analysis and financial planning in the digital age concept
Displaying Futuristic Data Dashboard with Translucent GUI, Line Charts on Purple Grid