- Home >
- Stock Photos >
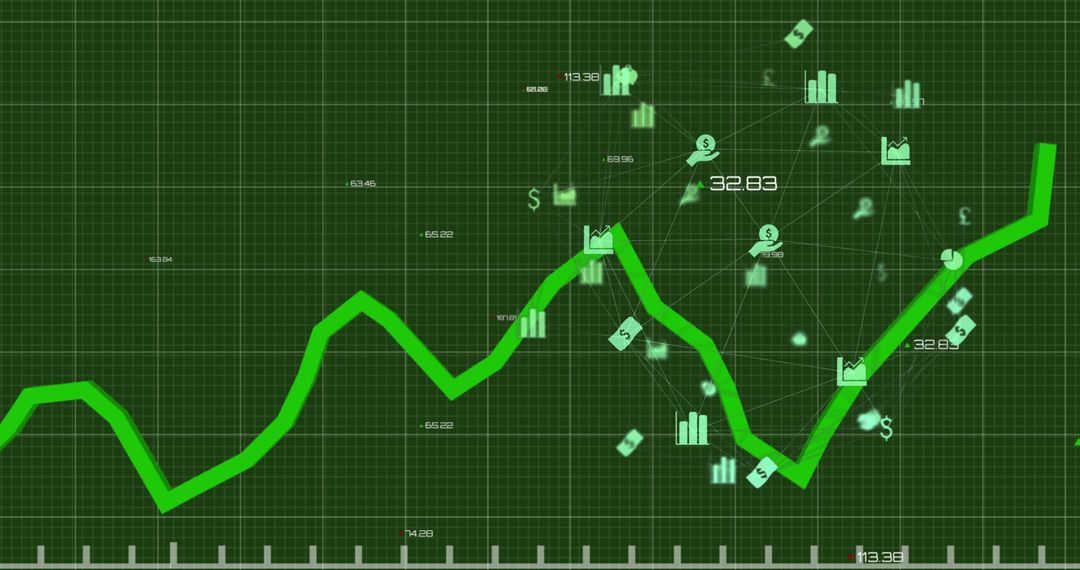
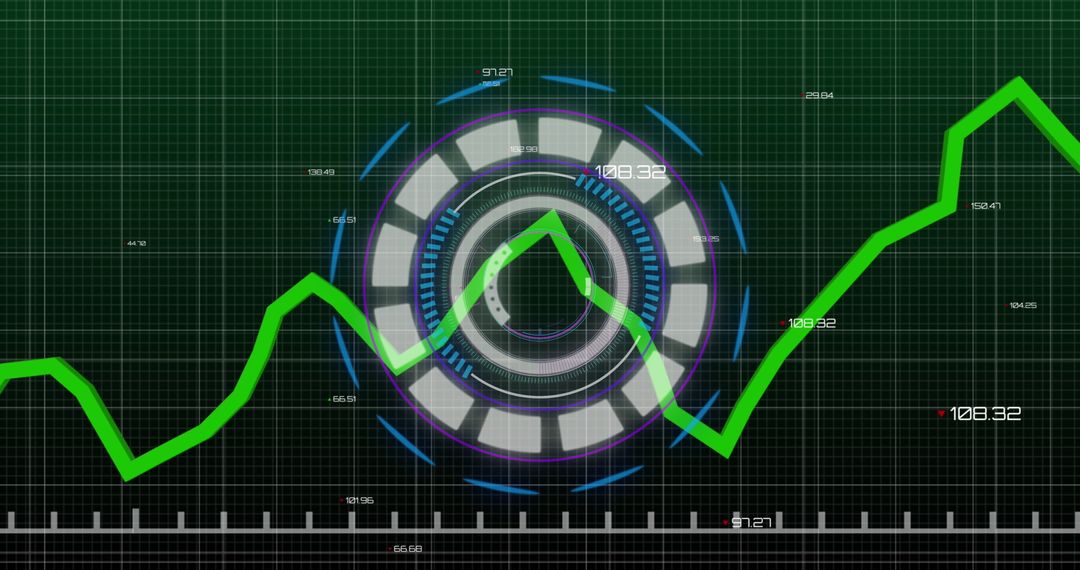
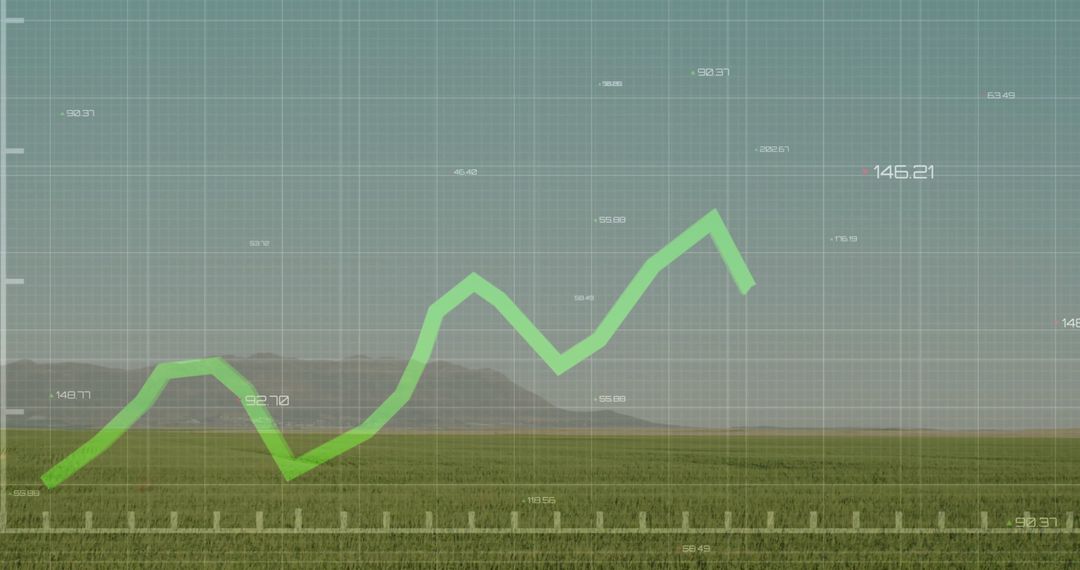
- Digital Green Line on Grid with Financial Data and Graphic Spiral Overlay
Digital Green Line on Grid with Financial Data and Graphic Spiral Overlay Image

Illustrating green line crossing digital grid, image ideal for financial news, analytics reports, dashboards, or technology solutions amplifying innovation. Symbolizes fluctuating markets, growth, and exploration, merging digital styles with economic narratives.
Powered by 


0
downloads
downloads
Tags:
More
Credit Photo
If you would like to credit the Photo, here are some ways you can do so
Text Link
photo Link
<span class="text-link">
<span>
<a target="_blank" href=https://pikwizard.com/photo/digital-green-line-on-grid-with-financial-data-and-graphic-spiral-overlay/353be3dad27dc1500336118fb74443ce/>PikWizard</a>
</span>
</span>
<span class="image-link">
<span
style="margin: 0 0 20px 0; display: inline-block; vertical-align: middle; width: 100%;"
>
<a
target="_blank"
href="https://pikwizard.com/photo/digital-green-line-on-grid-with-financial-data-and-graphic-spiral-overlay/353be3dad27dc1500336118fb74443ce/"
style="text-decoration: none; font-size: 10px; margin: 0;"
>
<img src="https://pikwizard.com/pw/medium/353be3dad27dc1500336118fb74443ce.jpg" style="margin: 0; width: 100%;" alt="" />
<p style="font-size: 12px; margin: 0;">PikWizard</p>
</a>
</span>
</span>
Free (free of charge)
Free for personal and commercial use.
Author: People Creations
Similar Free Stock Images
Premium


Premium


Premium


Premium


Premium


Premium


Premium


Premium


Premium


Premium


Premium


Premium


Premium


Premium


Premium


Premium


Premium


Premium


Premium


Premium


Premium


Premium