
- Home >
- Stock Photos >
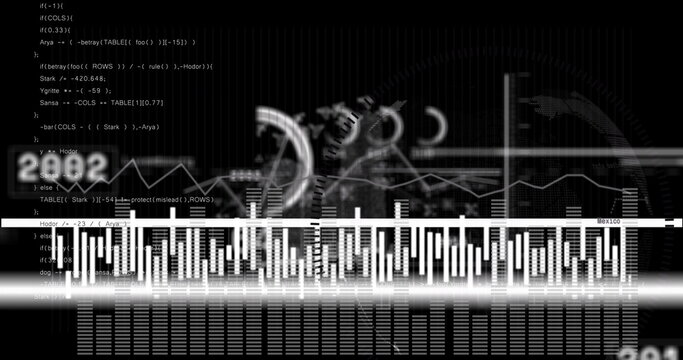
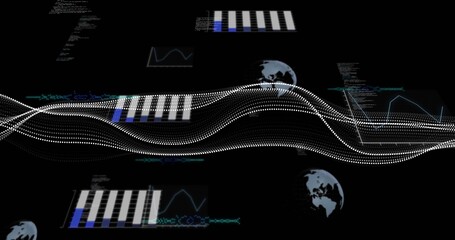
- Digital Interface with Bar Chart and Overlaid Code Snippets
Digital Interface with Bar Chart and Overlaid Code Snippets Image

Illustrates the integration of a digital dashboard displaying both visual data through a green bar chart and technical code elements in white. Useful for contexts involving data analytics, business intelligence software, or software development environments, highlighting the fusion of statistics visualization with programming.
Powered by 


downloads
Tags:
More
Credit Photo
If you would like to credit the Photo, here are some ways you can do so
Text Link
photo Link
<span class="text-link">
<span>
<a target="_blank" href=https://pikwizard.com/photo/digital-interface-with-bar-chart-and-overlaid-code-snippets/c6018e62fd3ecbc59b1c092286e6fd76/>PikWizard</a>
</span>
</span>
<span class="image-link">
<span
style="margin: 0 0 20px 0; display: inline-block; vertical-align: middle; width: 100%;"
>
<a
target="_blank"
href="https://pikwizard.com/photo/digital-interface-with-bar-chart-and-overlaid-code-snippets/c6018e62fd3ecbc59b1c092286e6fd76/"
style="text-decoration: none; font-size: 10px; margin: 0;"
>
<img src="https://pikwizard.com/pw/medium/c6018e62fd3ecbc59b1c092286e6fd76.jpg" style="margin: 0; width: 100%;" alt="" />
<p style="font-size: 12px; margin: 0;">PikWizard</p>
</a>
</span>
</span>
Free (free of charge)
Free for personal and commercial use.
Author: Authentic Images
Similar Free Stock Images

Premium


Premium

Premium


Premium


Premium


Premium


Premium


Premium


Premium
Premium

Premium


Premium


Premium


Premium


Premium


Premium


Premium


Premium


Premium


Premium


Premium

Premium


Premium


Premium


Premium


Explore More Free Stock Images