- Home >
- Stock Photos >
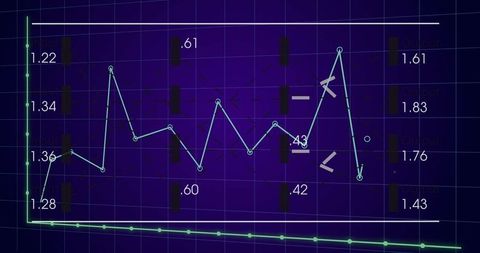
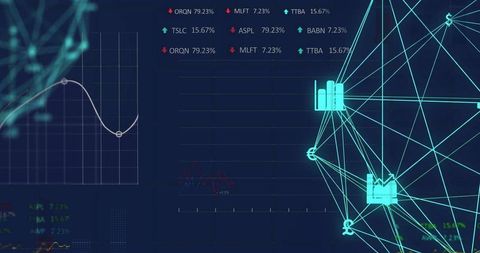
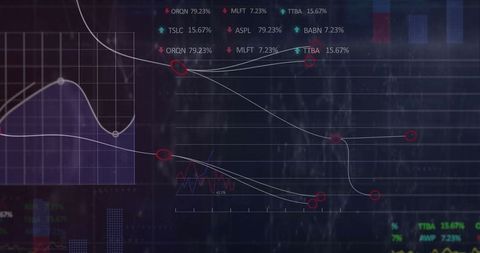
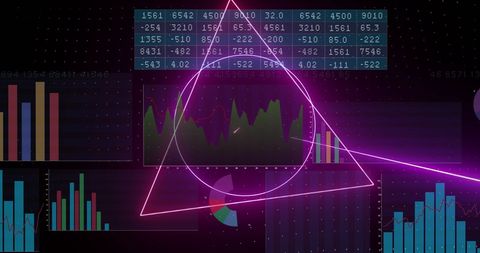
- Digital Interface with Dynamic Financial Data Visualization
Digital Interface with Dynamic Financial Data Visualization Image

Dynamic visualization of multiple mathematical and financial symbols set against an abstract background of glowing data trails, perfect for illustrating concepts in digital finance, stock market analysis, and data analytics. Useful in blog posts, financial presentations, and technology articles focusing on global finance trends and data processing.

downloads
Tags:
More
Credit Photo
If you would like to credit the Photo, here are some ways you can do so
Text Link
photo Link
<span class="text-link">
<span>
<a target="_blank" href=https://pikwizard.com/photo/digital-interface-with-dynamic-financial-data-visualization/a4a9bd482bde0f37460c77785f2b2c24/>PikWizard</a>
</span>
</span>
<span class="image-link">
<span
style="margin: 0 0 20px 0; display: inline-block; vertical-align: middle; width: 100%;"
>
<a
target="_blank"
href="https://pikwizard.com/photo/digital-interface-with-dynamic-financial-data-visualization/a4a9bd482bde0f37460c77785f2b2c24/"
style="text-decoration: none; font-size: 10px; margin: 0;"
>
<img src="https://pikwizard.com/pw/medium/a4a9bd482bde0f37460c77785f2b2c24.jpg" style="margin: 0; width: 100%;" alt="" />
<p style="font-size: 12px; margin: 0;">PikWizard</p>
</a>
</span>
</span>
Free (free of charge)
Free for personal and commercial use.
Author: People Creations