1. Home > 
  2. Stock Photos > 
  3. Digital Overlay of Business Data with Man Using Compass

Digital Overlay of Business Data with Man Using Compass Image

Digital Overlay of Business Data with Man Using Compass

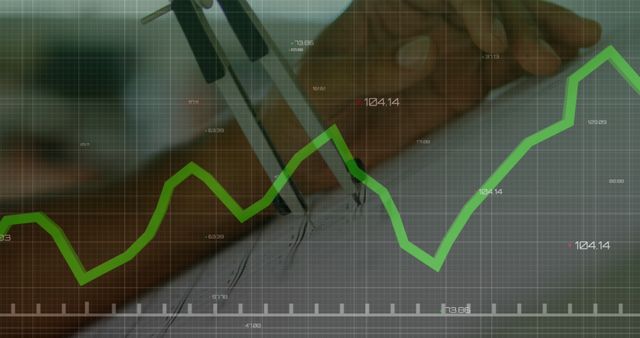
Modern scene shows statistical data graph over a man using a compass for planning, symbolizing integration of traditional planning tools and digital analytic technology. Ideal for use in articles or advertisements focusing on business strategy, financial analysis, and technological advancements in data processing.

Powered by Shutterstock logo - Get 15% off with code: PIKWIZARD15
Business team using tablet and laptop analyzing sales data, economic growth graph chart. Business planning and strategy. Financial report, market research. digital marketing, business data analysis - Powered by Shutterstock - Get 15% off with code: PIKWIZARD15Analyst working with Business, Concept digital transformation technology strategy, Analytics and Data Management System on computer, make a report with KPI and metrics connected to database. - Powered by Shutterstock - Get 15% off with code: PIKWIZARD15A businessman uses a laptop to access an AI-powered business analytics dashboard, showcasing charts, metrics, and KPIs. He analyzes performance data to generate. Data analysis concept.  - Powered by Shutterstock - Get 15% off with code: PIKWIZARD15Data anlytics, AI and database management technology. IT specilist working on digital tablet connecting with cloud server and data center, technology background. data science and engineering - Powered by Shutterstock - Get 15% off with code: PIKWIZARD15AI Artificial Intelligence. Business woman using AI technology for data analysis, coding computer language with digital brain, machine learning on virtual screen, business intelligence - Powered by Shutterstock - Get 15% off with code: PIKWIZARD15

Credit Photo

If you would like to credit the Photo, here are some ways you can do so

Free (free of charge)

Free for personal and commercial use.

Author: Creative Art

Similar Free Stock Images

Dynamic Financial Data Display in Digital Space
Premium
Company Operations Manager Holds Meeting Presentation. Diverse Team Uses TV Screen with Growth Analysis, Charts, Statistics and Data. People Work in Business Office.
Digital Financial Data Analyzing Over Circular Grid Display
Digital Interface Showing Global Business Data Analytics
Global Economy Displaying Growth Trends with Ukraine-NATO Financial Outlook
Innovative Data Analysis with Dynamic Line Graph and Digital Elements
Premium
Hands, person and typing on keyboard for research, information and data with system technology. Woman, screen and overlay with coding or software update and programming or upgrade on cybersecurity
Team Collaborating on Business Analysis with Digital Data Overlay
Futuristic Graph with Digital Globe Symbolizing Global Technology Connections
European Market Data Overlay with EU Flag and Financial Graphs
Analyzing Stock Market Trends with Dynamic Graphs and Data
Premium
Analyst Works on Personal Computer Showing business analytics dashboard with charts, metrics and KPI to analyze performance and create insight reports for operations management. Data analysis concept.
Digital Stock Market Green Graph Against Dark Trading Board
Digital Financial Data and Global Market Analysis on Graph
Business Women Analyzing Data in Office with Growth Chart Overlay
Financial Data Analysis with Team Collaboration in Office
Premium
Man look at the dashboard with graphs and charts. Concept of data management system, business intelligence, data statistics, marketing analysis, key performance indicators (KPI) and analytics.
Financial Data Processing on Tablet with Green Digital Overlay
Financial Growth Chart with Dynamic Green Line on Grid Overlay
Dynamic Green Stock Market Chart with Upward Arrows
Global Networking Concept with 6G Technology Display
Premium
Big Data concept. Digital neural network.Business woman hand touching Introduction of artificial intelligence. Cyberspace of future.Science and innovation of technology.
Line Graph Illustrating Data Trend on Green Digital Background
Dynamic Red Line Graph With Data Points on Gridded Background
Diverse Team Analyzing Growth Data in Collaborative Office Meeting
Global Data Analytics Over World Map with Numeric Statistics
Premium
Business analysis, trading concept, Businessman, finance analyst using digital tablet, analyzing financial graph, stock market report, economic graph growth chart, business and technology background
Digital Stock Market Graph Red Trendline on Green Background
Digital Financial Chart with Green Trend Line on Grid Background
Red Line Graph Displaying Complex Digital Trend Analysis
Red Line Chart Trending Downward in Data Visualization
Digital Currency Trading Interface with Data Visualization
Global Economic Trends Highlighted on World Map with Graphs
Premium
AI, Big Data, and business analytics icons represent the integration of advanced technology in analyzing graphs, business data, and market trends, driving strategic decisions and innovative solutions.
Digital Interface with Global Financial Graphs Background
Abstract Financial Chart Over Modern Cityscape
Green Line Rising on Digital Trading Board with Abstract Background
Futuristic Graph and Data Visualization Interface Design
Premium
Analyst working with Business Analytics and Data Management System on computer to make report with KPI and metrics connected to database. Corporate strategy for finance, operations, sales, marketing
Analyzing Data Trends on Digital Graph Interface
Digital Financial Data Graph Showcasing Market Trends
Dynamic Stock Market Graphs Over Digital Interface
Dynamic Financial Data Visualizations on Grid Interface
Premium
Data analytics automated with AI technology. Businessman use laptop and dashboard for Automating Data Management Analytics and Business Reports with KPI. AI chat bot. Database. Sales. Marketing.
Dynamic Data Display Generating Business Growth Analysis
Digital Data Visualization with Trend Lines and Percentage Changes
Colleagues Analyzing Financial Data on Digital Grid Interface
Diverse Business Team with Digital Growth Graph Overlay
Premium
Female Software Engineer Working in a Modern Monitoring Office with Live Analysis Feed with Charts on a Big Digital Screen. Monitoring Room Big Data Scientists and Managers Sit in Front of Computers.
City Skyline with Overlay of Financial Market Trends
Cybersecurity Concept with Declining Data Graph and Digital Shield
Financial Data Analysis Vibrant Graphs on Blue Background
Dynamic Financial Graphs Overlaying Modern Cityscape
Premium
Business team collaboration discussing working analyzing with financial data and marketing growth report graph in team, presentation and brainstorming to strategy planning making profit of company.
Green Line Graph with Data Points on Grid Background
Financial Data Analysis with Futuristic Technology Interface
Fluctuating Financial Graph on Green Grid Background
Green Line Graph on Dark Digital Grid
Premium
Black woman working in office and futuristic graphical user interface concept. ICT (Information Communication Technology). System engineering.
Dynamic Line Chart Representing Financial Data Growth
Fluctuating Line Graph on Analytics Dashboard
Digital Financial Analytics with Red Trends on Grid Screen
Line Graphs on Digital Background Show Financial Data Trends
Financial Data Charts with World Map on Blue Digital Background
Digital Financial Data Display with Graph and Grid
Premium
Financial advisor explaining invest stock market data consulting investor. Two busy business men analysts doing finance trading analysis pointing at exchange chart on laptop screen working in office.
Fluctuating Digital Stock Market Data Chart
Digital Data Analysis with Green Line Graph on Grid Background
Financial Data Line Graph on Digital Display
Dynamic Stock Market Graph Displaying Surging Growth
Premium
An analyst uses a computer and dashboard for data business analysis and Data Management System with KPI and metrics connected to the database for technology finance, operations, sales, marketing
Dynamic Green Line Graph Showing Financial Data Fluctuations
Growth Trend with Green Line Overlay and Modern Cityscape
Green Financial Line Graph with Candlestick Data on Grid Background
Digital Finance Chart Overlaying Globe Background
Premium
Man uses a laptop and AI Artificial Intelligence technology for data analysis, research, planning, and work generate. Technology smart robot AI agents and agentic workflows.
Abstract Digital Data with Upward Trending Line Graph
Futuristic Global Finance Chart with Rotating Globe Animation
Rising Financial Data Graph on Digital Grid Background
Green Data Graph on Black Digital Interface
Premium
Big data analysis with AI technology for business analytics. Insights from data mining, filtering, sorting, clustering. Data scientist working on machine learning on virtual computer screen.
Binary Code and Financial Data on Digital Screen
NFT Financial Data Visualization with Digital Graph Overlay
Dynamic Financial Graphs Overlaying Urban Skyline
Green Line Graph Overlapping Data Server Racks in Technology Center
Premium
Young happy professional business woman employee sitting at desk working on laptop in modern corporate office interior. Smiling female worker using computer technology typing browsing web.
Dynamic Financial Data on Digital Screen
Digital Data Visualization Over Server Rows
Financial Growth Stock Nikkei in Urban City Skyline
Futuristic Digital Graph Showing Data Trends on Analytic Interface
Premium
Business finance data analytics graph chart report, man using laptop computer hand typing investment data digital marketing KPI sale report, financial management technology, cyber space metaverse.
Business Women Analyzing Financial Growth Trends with Graph Overlay
Green Data Line Sweeping Across Futuristic Dashboard Grid Showing Analytics Trend and Telemetry
Graph Lines Portraying Financial Data Trends
Futuristic Digital Data Analytics Interface Display
Stagflation Concept with Financial Data Coding Overlay
Abstract Financial Data Visualization in Server Room
Premium
Banking business, finance and investment concept. Businessman analyzing market data, financial graph report, economic growth, business strategy, planning and solution, risk management
Business Team Analyzing Financial Downtrend Data in Modern Office
Businesswomen Collaborating with Data Analytics Overlay in Modern Office
Financial Graph Analysis on Green Grid Background
Social Media Activity Icons on Digital Graph
Premium
Two diverse crypto traders brokers stock exchange market investors discussing trading charts research reports growth using pc computer looking at screen analyzing invest strategy, financial risks.
Data Analytics Graphs on Digital Interface Background
Green Financial Line Chart Over Modern Office Buildings
Financial Graphs Displaying Business Trends on Grid Background
Financial Graphs Overlaying Shopping Bag Representation Economy
Premium
Data analytics and insights powered by big data and artificial intelligence technologies. Data scientist working with complex information analysed by AI for business analytics dashboard with charts.
Rising Graph Line on Digital Green Grid Background
Digital Financial Analysis with Tablets and Data Visualizations
Digital Data Processing Interface with Green Growth Chart
Dynamic Green Line Graph Depicting Financial Data
Premium
A hand interacts with holographic data visuals above a laptop, showcasing modern technology and data analysis.
Digital Graph Displaying Dynamic Data Analysis
Cityscape with Digital Stock Market Graphs and Statistics
Business Growth Graphs Overlay Designer Creating Patterns
Business Colleagues Analyzing Financial Graph in Office Meeting
Premium
Data science, digital technology, AI, Business Intelligence, big data management and global internet network connection, Digital software technology and global business development
Abstract Representation of Financial Data Processing
Digital Graphs and Data Visualization on Green Background
Digital Green Line Graph Over Grid with Statistics and Numbers
Smiling Professional with Declining Graph in Modern Office
Premium
Analyst working on business analytics dashboard with KPI, charts and metrics to analyze data and create insight reports for executives and strategical decisions. Operations and performance management.
Thick red trend line declining across dashboard grid with green markers and labels