- Home >
- Stock Photos >
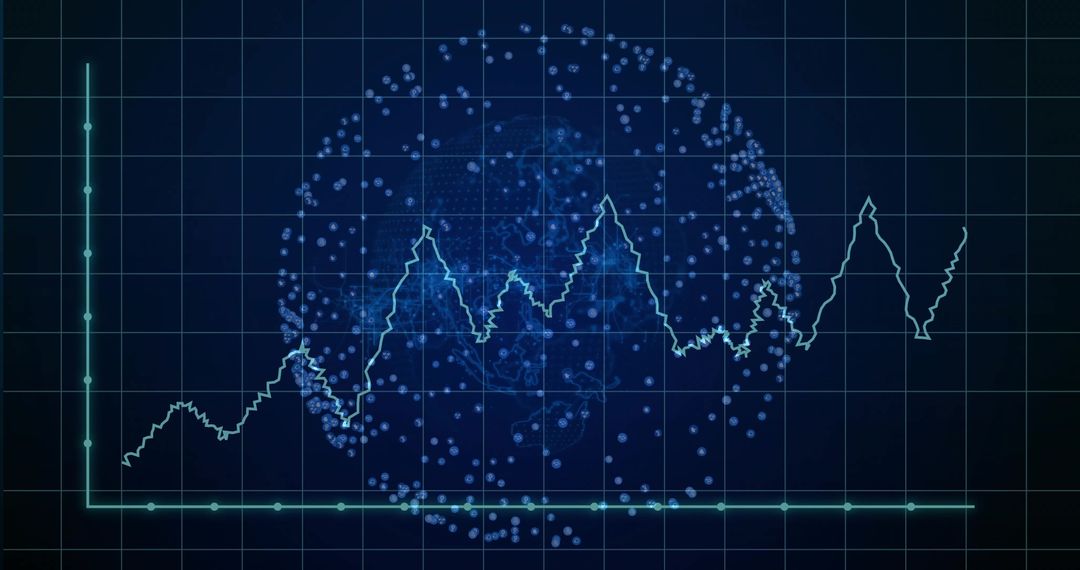
- Digital Security In Financial Analytics Showing Data Chart and Padlock
Digital Security In Financial Analytics Showing Data Chart and Padlock Image

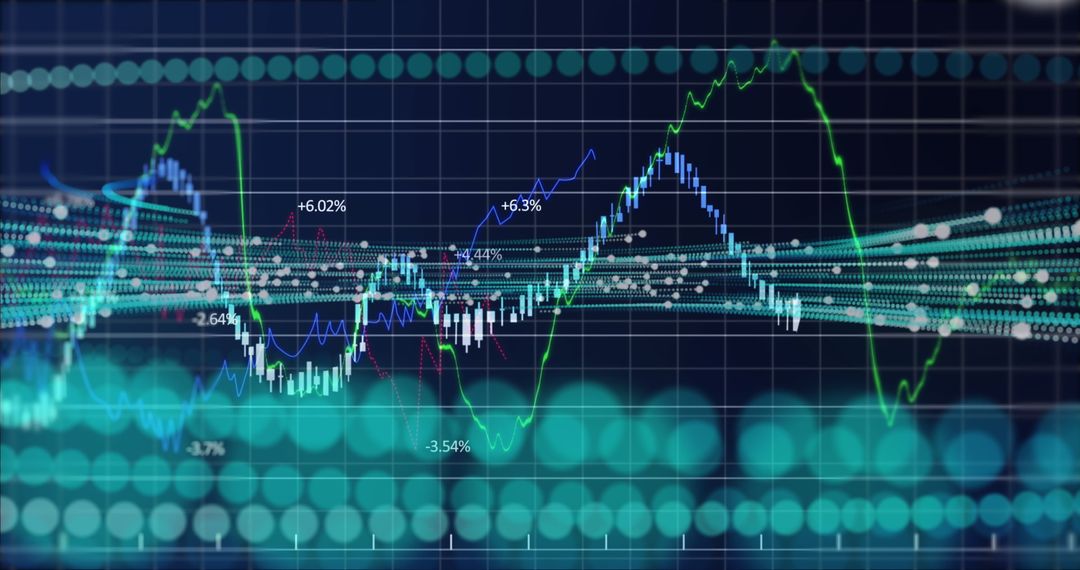
This conceptual image illustrates digital security within financial analytics through a vivid data chart and padlock icon. Incorporating elements like a fluctuating graph and security symbol against a blue background, it immediately communicates themes of cybersecurity, safeguarding financial data, and global business dynamics. Ideal for use in presentations, articles, or websites about cyber defense in finance, investment safety, digital transformation, or economic technology innovation. It serves as a figurative depiction of protecting sensitive while dealing with digital financial threats and economic volatility.
Powered by 


0
downloads
downloads
Tags:
More
Credit Photo
If you would like to credit the Photo, here are some ways you can do so
Text Link
photo Link
<span class="text-link">
<span>
<a target="_blank" href=https://pikwizard.com/photo/digital-security-in-financial-analytics-showing-data-chart-and-padlock/c2adc37d2fd70411bd118d2e7f1f63a6/>PikWizard</a>
</span>
</span>
<span class="image-link">
<span
style="margin: 0 0 20px 0; display: inline-block; vertical-align: middle; width: 100%;"
>
<a
target="_blank"
href="https://pikwizard.com/photo/digital-security-in-financial-analytics-showing-data-chart-and-padlock/c2adc37d2fd70411bd118d2e7f1f63a6/"
style="text-decoration: none; font-size: 10px; margin: 0;"
>
<img src="https://pikwizard.com/pw/medium/c2adc37d2fd70411bd118d2e7f1f63a6.jpg" style="margin: 0; width: 100%;" alt="" />
<p style="font-size: 12px; margin: 0;">PikWizard</p>
</a>
</span>
</span>
Free (free of charge)
Free for personal and commercial use.
Author: People Creations
Similar Free Stock Images

Premium


Premium


Premium


Premium


Premium


Premium


Premium


Premium


Premium


Premium


Premium


Premium


Premium


Premium


Premium


Premium


Premium


Premium


Premium


Premium


Premium


Premium


Premium


Premium