- Home >
- Stock Photos >
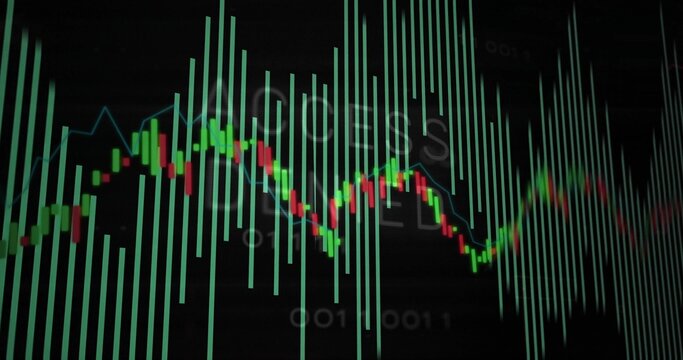
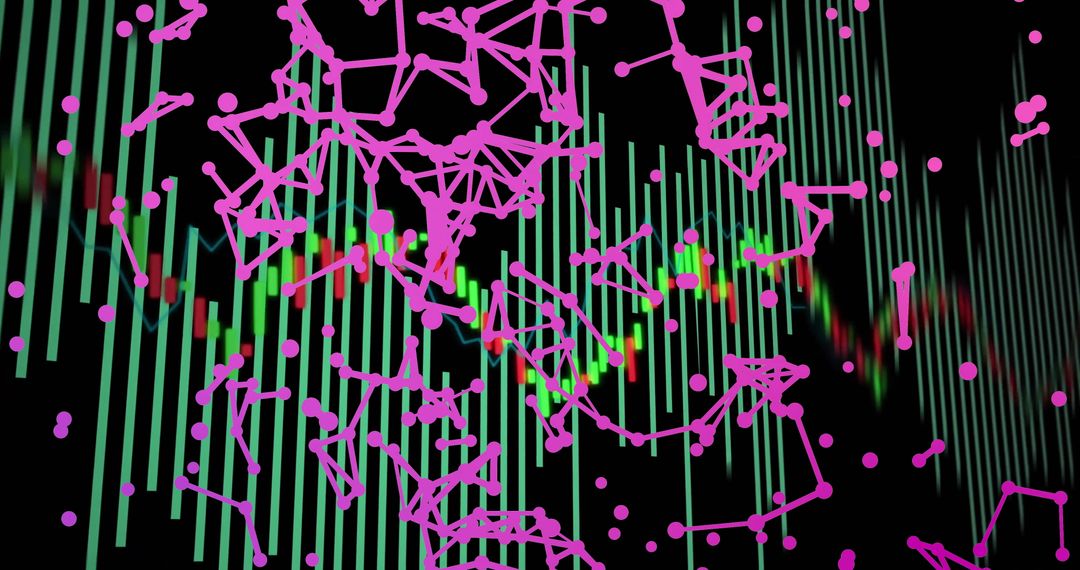
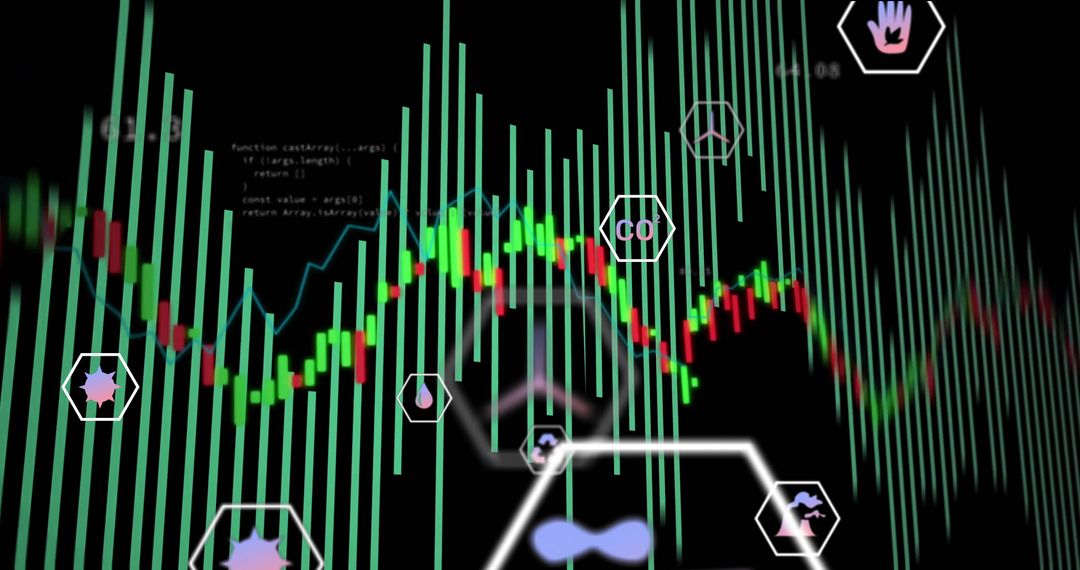
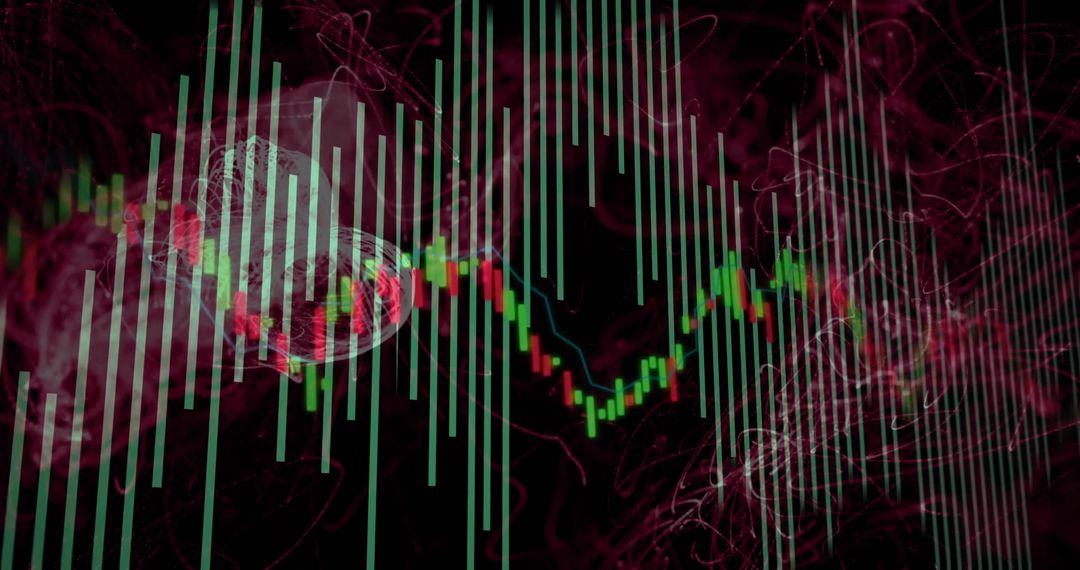
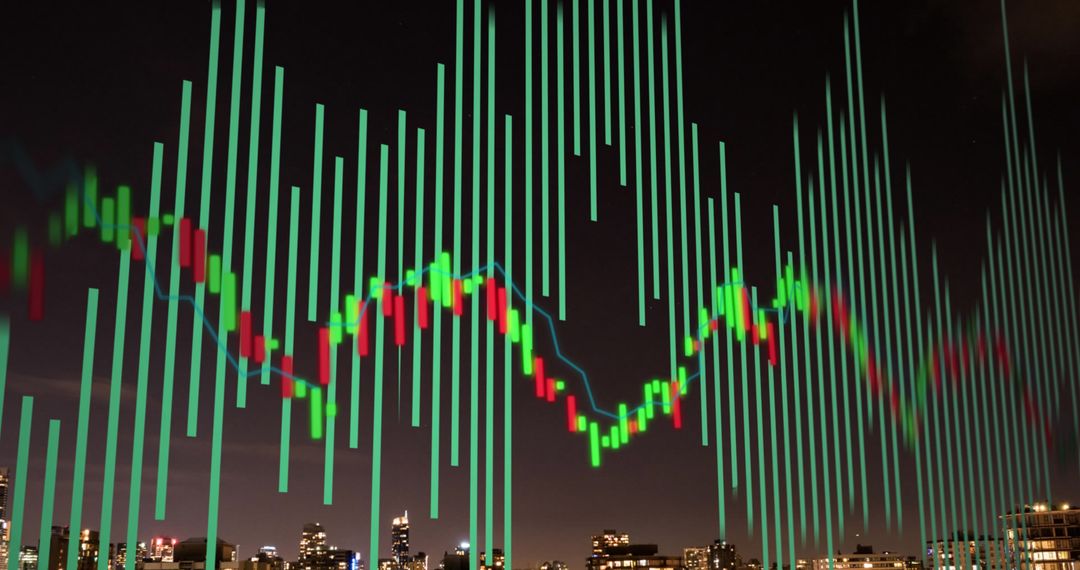
- Digital Stock Chart with Abstract Network in Pink Hues
Digital Stock Chart with Abstract Network in Pink Hues Image

Futuristic representation of a dynamic candlestick chart illuminated with vibrant green bars and a trendline, overlayed by a sprawling network of abstract pink nodes. Suitable for conveying modern financial analytics, market trends, stock trading insights, data science presentations, and technology-oriented marketing. Perfect for use in presentations, financial dashboards, fintech websites, and educational material relating to finance technology.
Powered by 


0
downloads
downloads
Tags:
More
Credit Photo
If you would like to credit the Photo, here are some ways you can do so
Text Link
photo Link
<span class="text-link">
<span>
<a target="_blank" href=https://pikwizard.com/photo/digital-stock-chart-with-abstract-network-in-pink-hues/823a0c1b37d3e3c32810fe0ae706c025/>PikWizard</a>
</span>
</span>
<span class="image-link">
<span
style="margin: 0 0 20px 0; display: inline-block; vertical-align: middle; width: 100%;"
>
<a
target="_blank"
href="https://pikwizard.com/photo/digital-stock-chart-with-abstract-network-in-pink-hues/823a0c1b37d3e3c32810fe0ae706c025/"
style="text-decoration: none; font-size: 10px; margin: 0;"
>
<img src="https://pikwizard.com/pw/medium/823a0c1b37d3e3c32810fe0ae706c025.jpg" style="margin: 0; width: 100%;" alt="" />
<p style="font-size: 12px; margin: 0;">PikWizard</p>
</a>
</span>
</span>
Free (free of charge)
Free for personal and commercial use.
Author: Authentic Images
Similar Free Stock Images

Premium


Premium


Premium


Premium


Premium


Premium


Premium


Premium


Premium


Premium


Premium


Premium


Premium


Premium


Premium


Premium


Premium