- Home >
- Stock Photos >
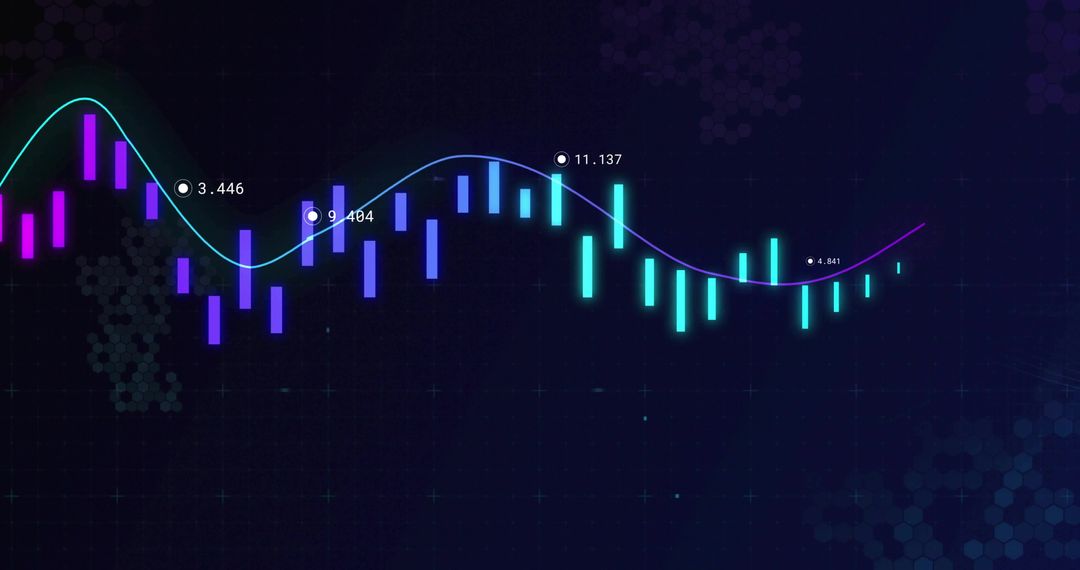
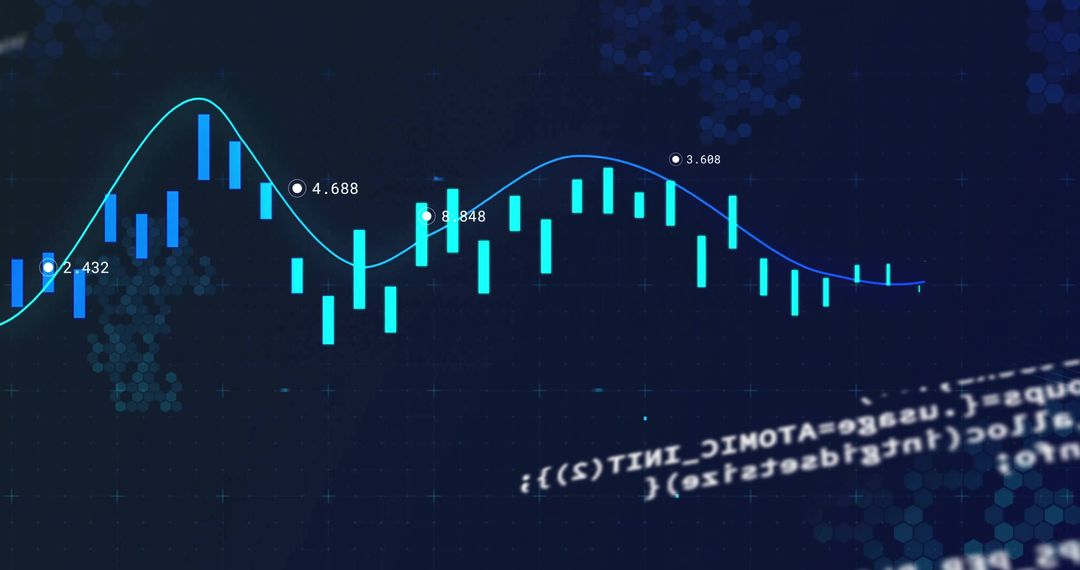
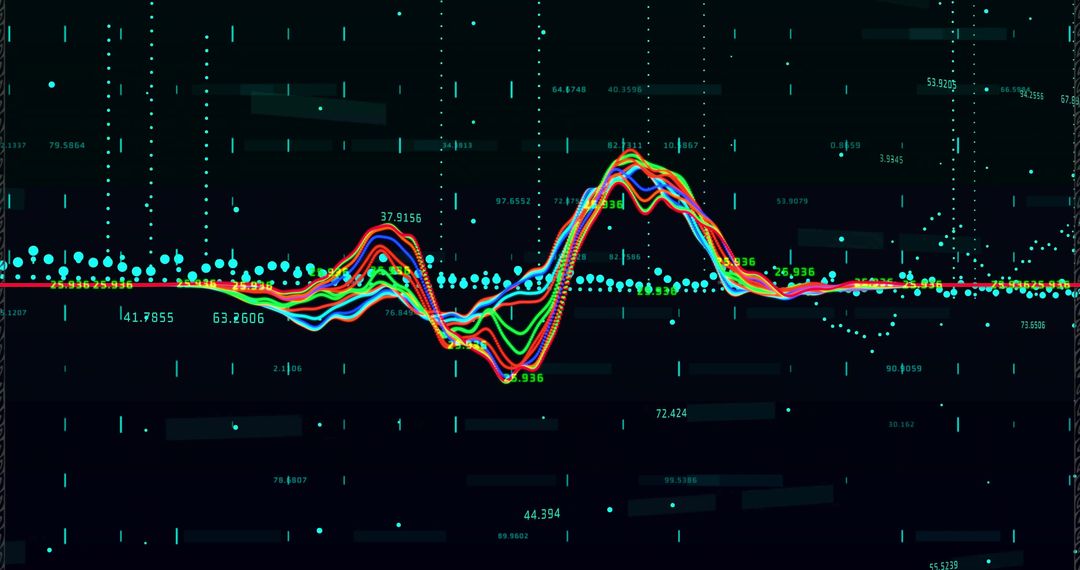
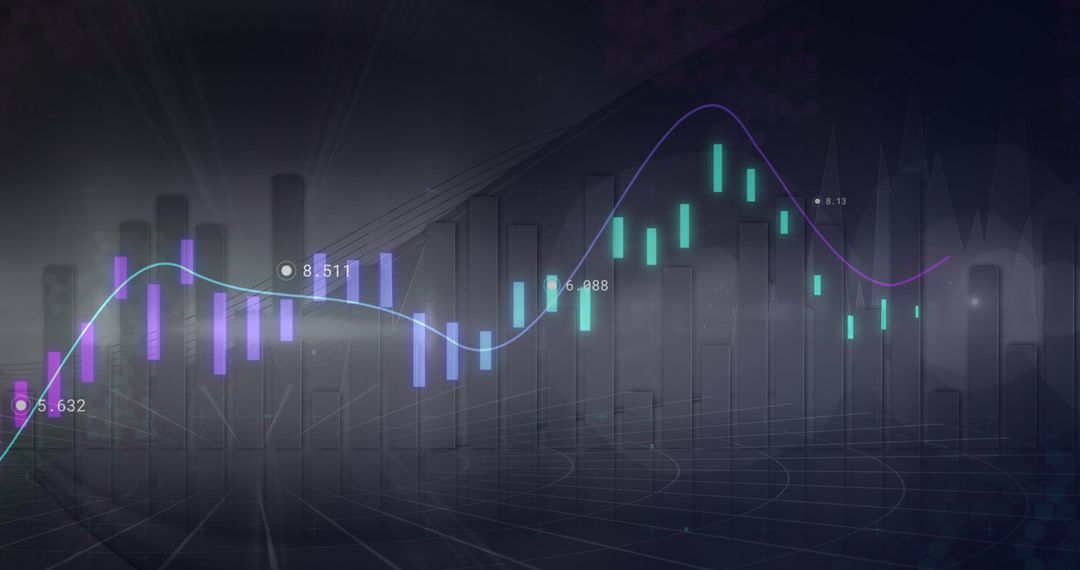
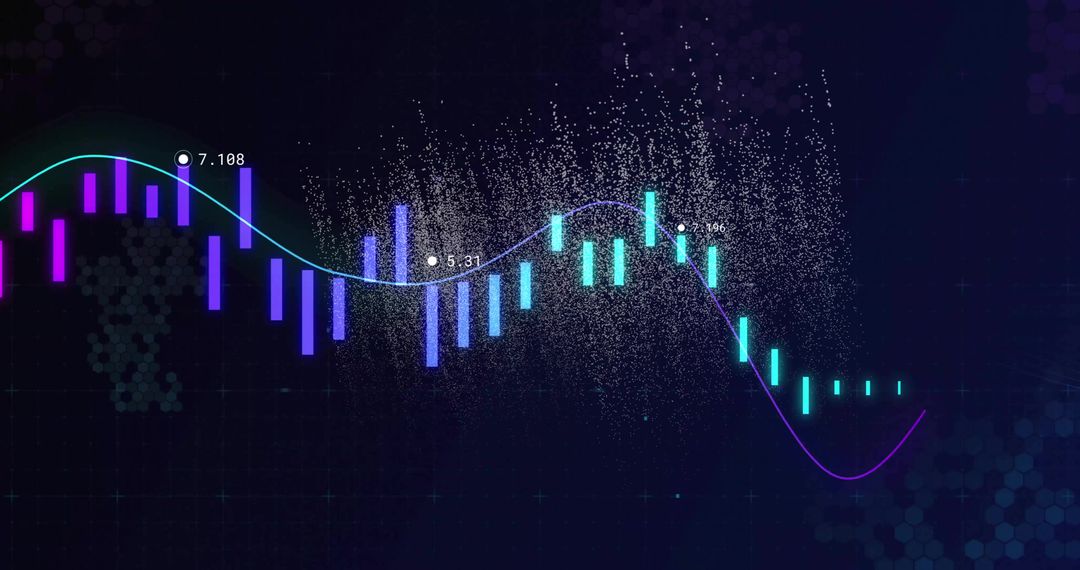
- Digital Stock Market Chart with Candlesticks and Line Graph
Digital Stock Market Chart with Candlesticks and Line Graph Image

Colorful candlestick bars and a line graph on a dark screen create a futuristic, analytical atmosphere, perfect for illustrating articles or blogs about stock market strategies, financial analysis, technology-driven finance adventures or showcasing advances in data visualization tools. It suits applications related to fintech platforms, digital progress in financial markets, and dynamic historical trends for educational and business uses.
Powered by  - Get 15% off with code: PIKWIZARD15


2
downloads
downloads
Tags:
More
Credit Photo
If you would like to credit the Photo, here are some ways you can do so
Text Link
photo Link
<span class="text-link">
<span>
<a target="_blank" href=https://pikwizard.com/photo/digital-stock-market-chart-with-candlesticks-and-line-graph/1196656ea05024c46156f7983b3a3112/>PikWizard</a>
</span>
</span>
<span class="image-link">
<span
style="margin: 0 0 20px 0; display: inline-block; vertical-align: middle; width: 100%;"
>
<a
target="_blank"
href="https://pikwizard.com/photo/digital-stock-market-chart-with-candlesticks-and-line-graph/1196656ea05024c46156f7983b3a3112/"
style="text-decoration: none; font-size: 10px; margin: 0;"
>
<img src="https://pikwizard.com/pw/medium/1196656ea05024c46156f7983b3a3112.jpg" style="margin: 0; width: 100%;" alt="" />
<p style="font-size: 12px; margin: 0;">PikWizard</p>
</a>
</span>
</span>
Free (free of charge)
Free for personal and commercial use.
Author: Awesome Content
Similar Free Stock Images

Premium


Premium


Premium


Premium


Premium


Premium


Premium


Premium


Premium


Premium


Premium


Premium


Premium


Premium


Premium


Premium


Premium


Premium


Premium


Premium


Premium


Premium


Premium


Premium