
- Home >
- Stock Photos >
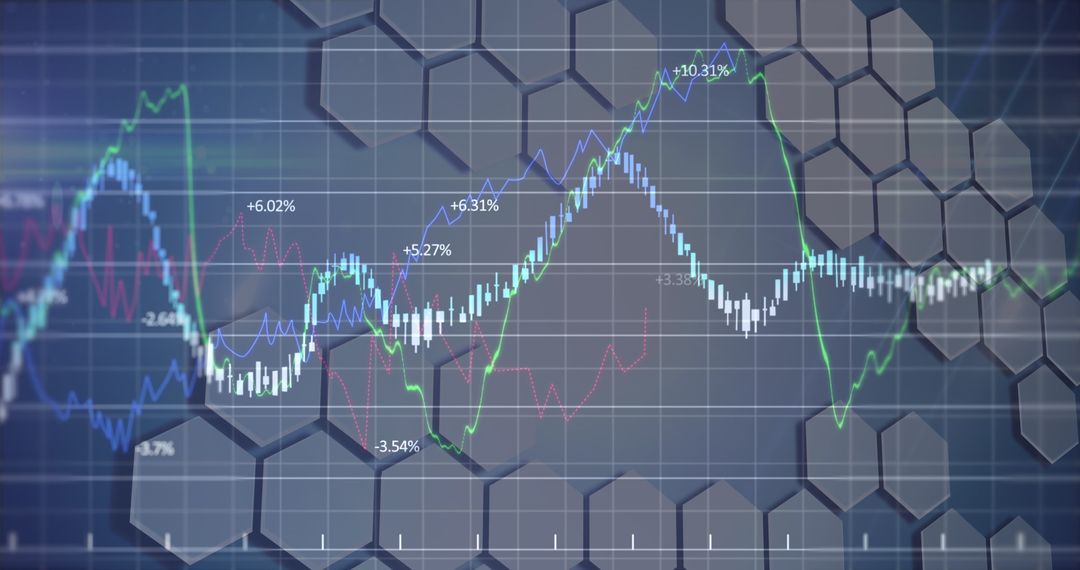
- Digital Stock Market Graph Displaying Financial Trends
Digital Stock Market Graph Displaying Financial Trends Image

The image showcases a digital stock market graph representing fluctuating data and financial trends. With its high-tech presentation of graphs, percentages, and charts, it illustrates the dynamic nature of financial markets. Ideal for use in finance-related presentations, investment strategies discussions, analytics articles, or business growth reports. Its modern and engaging design makes it suitable for web content related to economy and stock exchange insights.
Powered by  - Get 15% off with code: PIKWIZARD15


2
downloads
downloads
Tags:
More
Credit Photo
If you would like to credit the Photo, here are some ways you can do so
Text Link
photo Link
<span class="text-link">
<span>
<a target="_blank" href=https://pikwizard.com/photo/digital-stock-market-graph-displaying-financial-trends/562e5121788e5d321e6d95a24d0e6321/>PikWizard</a>
</span>
</span>
<span class="image-link">
<span
style="margin: 0 0 20px 0; display: inline-block; vertical-align: middle; width: 100%;"
>
<a
target="_blank"
href="https://pikwizard.com/photo/digital-stock-market-graph-displaying-financial-trends/562e5121788e5d321e6d95a24d0e6321/"
style="text-decoration: none; font-size: 10px; margin: 0;"
>
<img src="https://pikwizard.com/pw/medium/562e5121788e5d321e6d95a24d0e6321.jpg" style="margin: 0; width: 100%;" alt="" />
<p style="font-size: 12px; margin: 0;">PikWizard</p>
</a>
</span>
</span>
Free (free of charge)
Free for personal and commercial use.
Author: People Creations
Similar Free Stock Images

Premium


Premium


Premium


Premium


Premium


Premium


Premium


Premium


Premium


Premium


Premium


Premium


Premium


Premium


Premium


Premium


Premium


Premium


Premium


Premium


Premium


Premium


Premium


Premium

