- Home >
- Stock Photos >
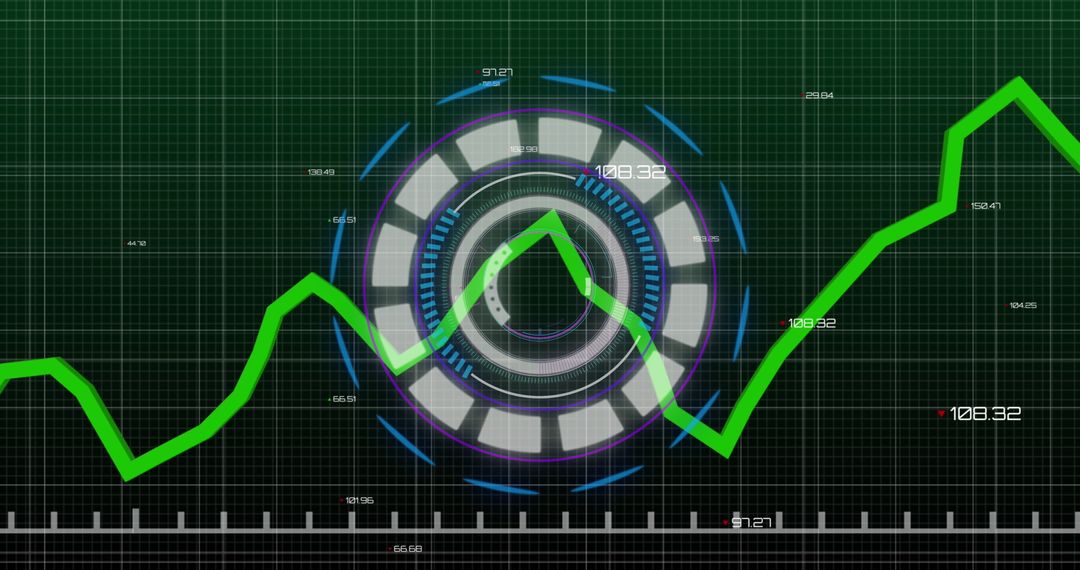
- Digital Stock Market Graph with Abstract Coding Background
Digital Stock Market Graph with Abstract Coding Background Image

Illustration showing a dynamic stock market graph rising across a green digital interface. Computer coding elements and a globe highlight globalization and technology aspects. Suitable for use in presentations about data analysis, financial technology, global business trends, or technological advancements in market analysis.
Powered by  - Get 15% off with code: PIKWIZARD15


2
downloads
downloads
Tags:
More
Credit Photo
If you would like to credit the Photo, here are some ways you can do so
Text Link
photo Link
<span class="text-link">
<span>
<a target="_blank" href=https://pikwizard.com/photo/digital-stock-market-graph-with-abstract-coding-background/cf1006b6721e78dd5233a58f4a0006ef/>PikWizard</a>
</span>
</span>
<span class="image-link">
<span
style="margin: 0 0 20px 0; display: inline-block; vertical-align: middle; width: 100%;"
>
<a
target="_blank"
href="https://pikwizard.com/photo/digital-stock-market-graph-with-abstract-coding-background/cf1006b6721e78dd5233a58f4a0006ef/"
style="text-decoration: none; font-size: 10px; margin: 0;"
>
<img src="https://pikwizard.com/pw/medium/cf1006b6721e78dd5233a58f4a0006ef.jpg" style="margin: 0; width: 100%;" alt="" />
<p style="font-size: 12px; margin: 0;">PikWizard</p>
</a>
</span>
</span>
Free (free of charge)
Free for personal and commercial use.
Author: People Creations
Similar Free Stock Images

Premium


Premium


Premium


Premium


Premium


Premium


Premium


Premium


Premium


Premium


Premium


Premium


Premium


Premium


Premium


Premium


Premium


Premium


Premium


Premium


Premium


Premium


Premium


Premium