
- Home >
- Stock Photos >
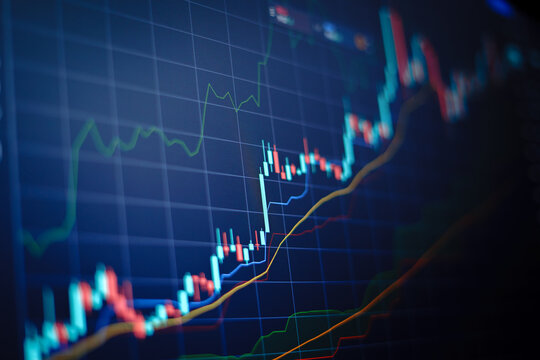
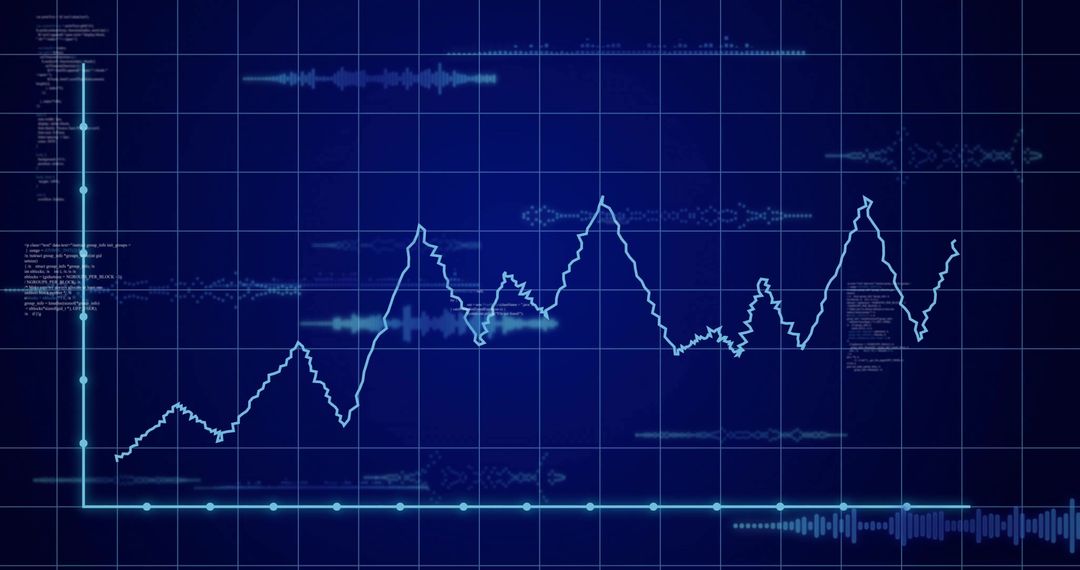
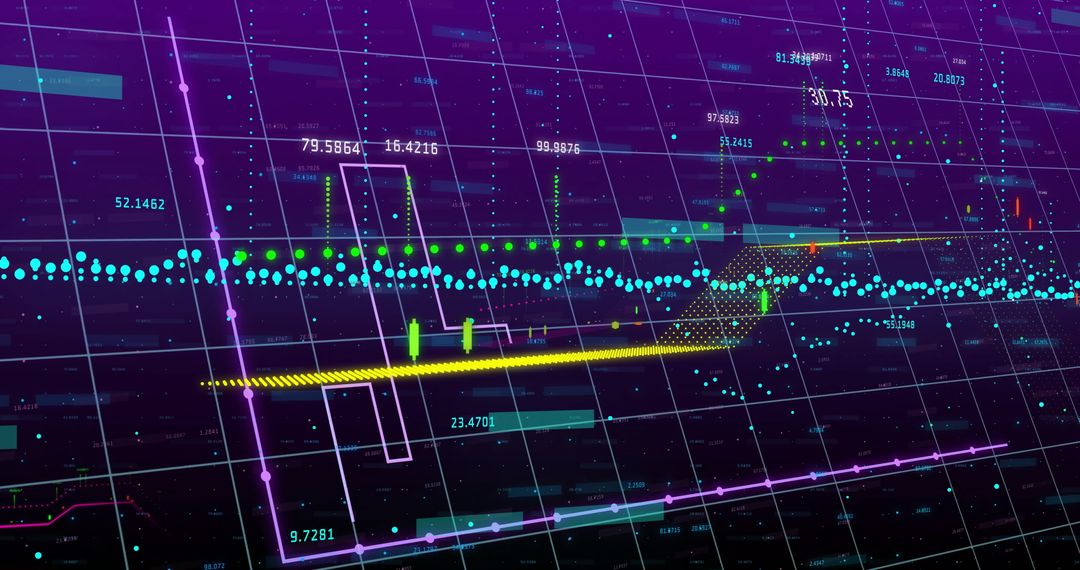
- Digital trading screen with rising charts and data analytics
Digital trading screen with rising charts and data analytics Image

Visual conveys advanced digital financial market monitoring with focus on a rising line chart. Suitable for illustrating stock market analysis, data visualization, and investment related content on financial pages or technology-driven investment platforms. Offers a futuristic feel for articles about tech advances in finance and economy.
Powered by 


2
downloads
downloads
Tags:
More
Credit Photo
If you would like to credit the Photo, here are some ways you can do so
Text Link
photo Link
<span class="text-link">
<span>
<a target="_blank" href=https://pikwizard.com/photo/digital-trading-screen-with-rising-charts-and-data-analytics/30a4833422b563901e813921d6ee8530/>PikWizard</a>
</span>
</span>
<span class="image-link">
<span
style="margin: 0 0 20px 0; display: inline-block; vertical-align: middle; width: 100%;"
>
<a
target="_blank"
href="https://pikwizard.com/photo/digital-trading-screen-with-rising-charts-and-data-analytics/30a4833422b563901e813921d6ee8530/"
style="text-decoration: none; font-size: 10px; margin: 0;"
>
<img src="https://pikwizard.com/pw/medium/30a4833422b563901e813921d6ee8530.jpg" style="margin: 0; width: 100%;" alt="" />
<p style="font-size: 12px; margin: 0;">PikWizard</p>
</a>
</span>
</span>
Free (free of charge)
Free for personal and commercial use.
Author: Authentic Images
Similar Free Stock Images

Premium


Premium


Premium


Premium


Premium


Premium


Premium


Premium


Premium


Premium


Premium


Premium


Premium


Premium


Premium


Premium


Premium


Premium


Premium


Premium


Premium


Premium


Premium


Premium

