- Home >
- Stock Photos >
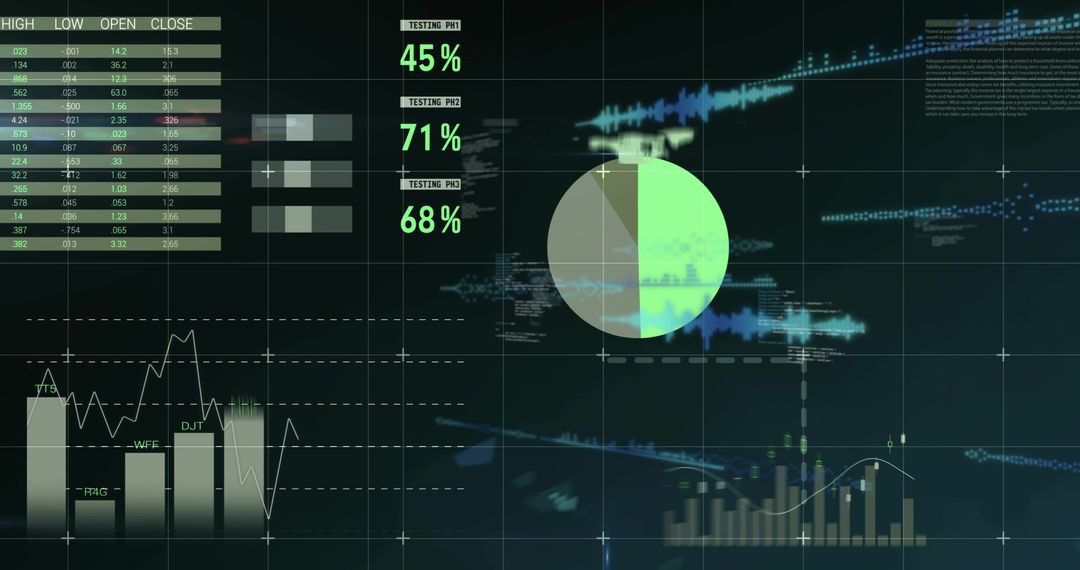
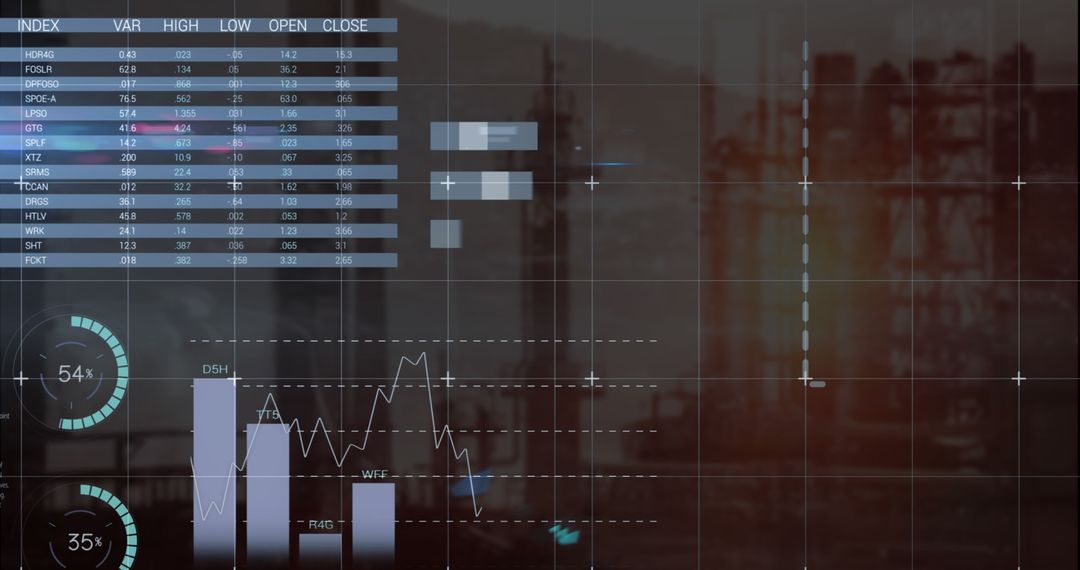
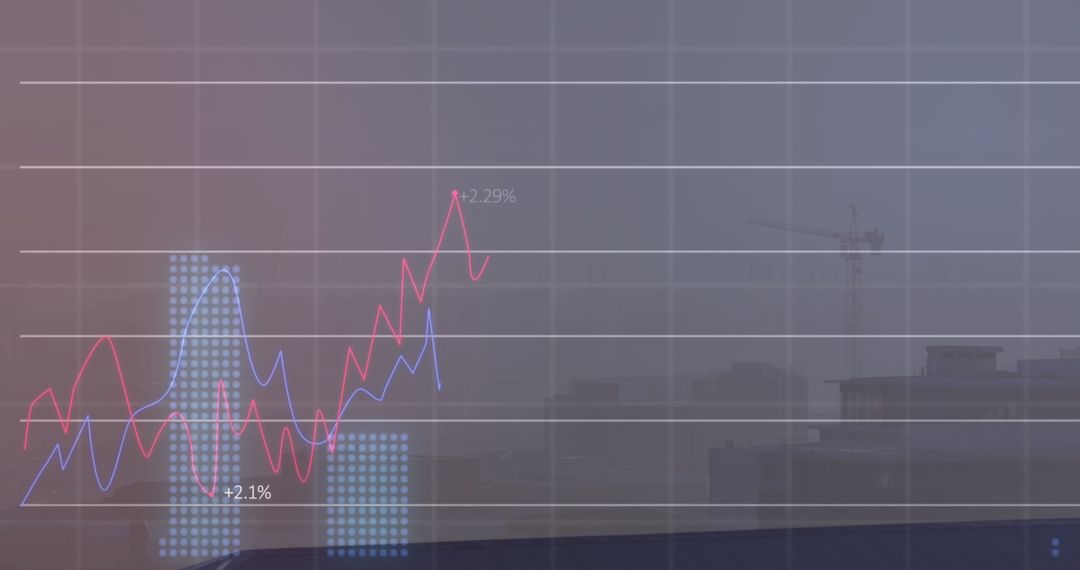
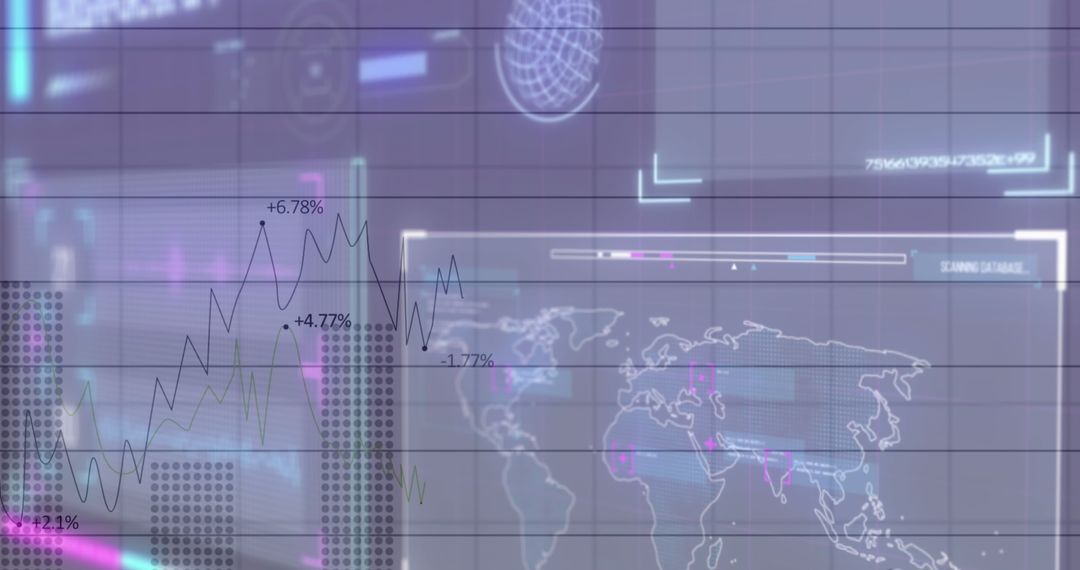
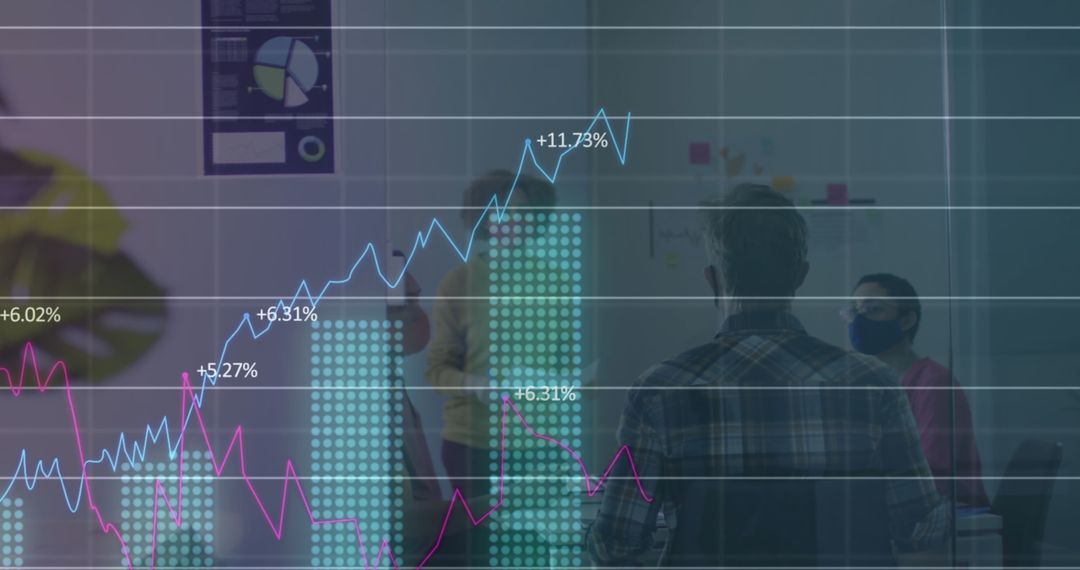
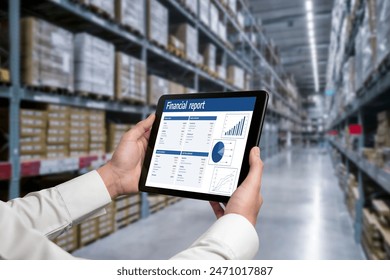
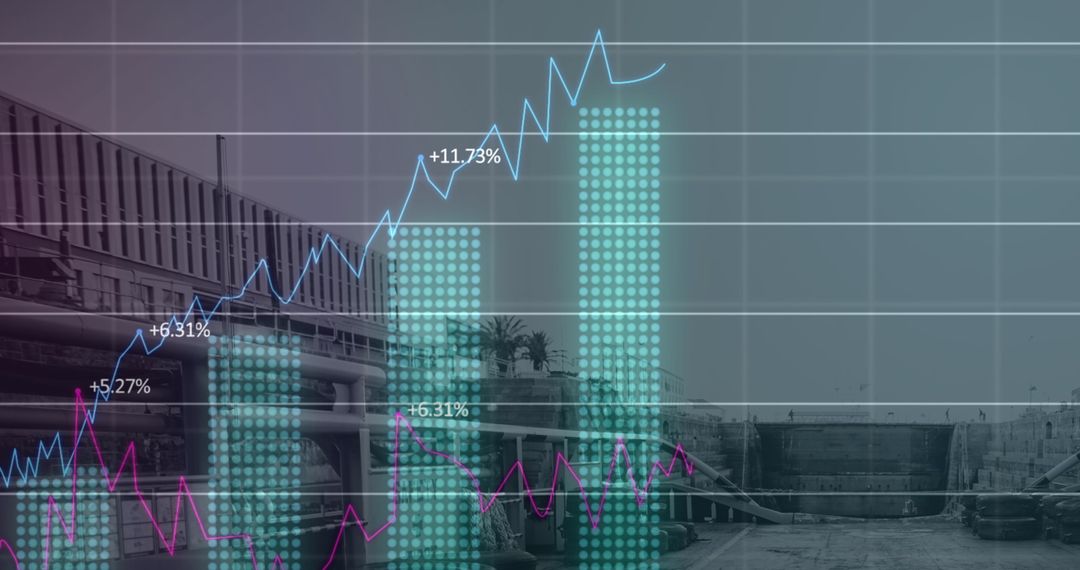
- Digitally Overlaid Financial Graphs in Modern Warehouse Environment
Digitally Overlaid Financial Graphs in Modern Warehouse Environment Image
Concept of modern trade and digital economy. Visual data such as financial graphs, pie charts, and world maps blend with warehouse shelves, suggesting integration of technology in supply chain and logistics. Ideal for illustrating the impact of data analytics on distribution, depiction of innovative trade solutions, and representation of financial strategy analysis.
Powered by  - Get 15% off with code: PIKWIZARD15


2
downloads
downloads
Tags:
More
Credit Photo
If you would like to credit the Photo, here are some ways you can do so
Text Link
photo Link
<span class="text-link">
<span>
<a target="_blank" href=https://pikwizard.com/photo/digitally-overlaid-financial-graphs-in-modern-warehouse-environment/d41962113a1d49a38f4d97db0ddea1dc/>PikWizard</a>
</span>
</span>
<span class="image-link">
<span
style="margin: 0 0 20px 0; display: inline-block; vertical-align: middle; width: 100%;"
>
<a
target="_blank"
href="https://pikwizard.com/photo/digitally-overlaid-financial-graphs-in-modern-warehouse-environment/d41962113a1d49a38f4d97db0ddea1dc/"
style="text-decoration: none; font-size: 10px; margin: 0;"
>
<img src="https://pikwizard.com/pw/medium/d41962113a1d49a38f4d97db0ddea1dc.jpg" style="margin: 0; width: 100%;" alt="" />
<p style="font-size: 12px; margin: 0;">PikWizard</p>
</a>
</span>
</span>
Free (free of charge)
Free for personal and commercial use.
Author: People Creations
Similar Free Stock Images

Premium


Premium


Premium


Premium


Premium


Premium


Premium


Premium


Premium


Premium


Premium


Premium


Premium


Premium


Premium


Premium


Premium


Premium


Premium


Premium


Premium


Premium


Premium


Premium