
- Home >
- Stock Photos >
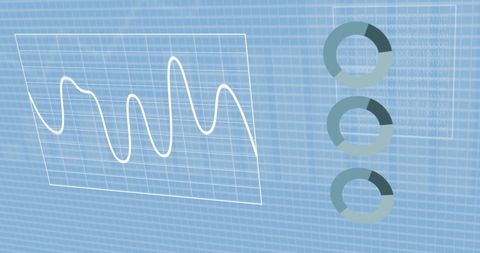
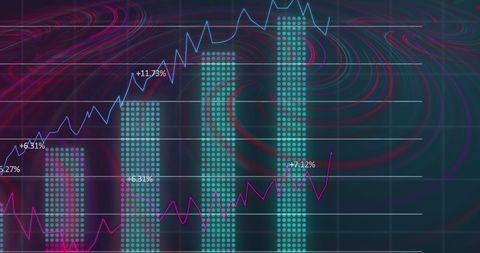
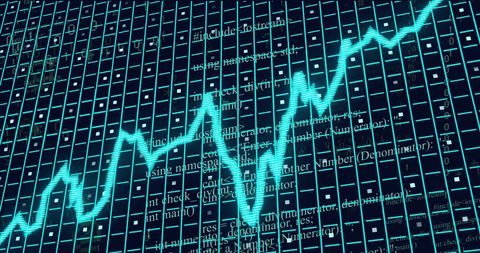
- Digitized Financial Data Analysis on Screens
Digitized Financial Data Analysis on Screens Image
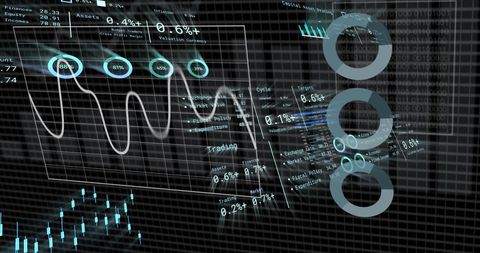
Visual representation of financial data processing, featuring dynamic charts and graphs overlaid on a high-tech background. Ideal for use in presentations, articles, or reports discussing trends in global finance, data analytics, fintech advancements, and investment strategies.
Powered by  - Get 15% off with code: PIKWIZARD15


downloads
Tags:
More
Credit Photo
If you would like to credit the Photo, here are some ways you can do so
Text Link
photo Link
<span class="text-link">
<span>
<a target="_blank" href=https://pikwizard.com/photo/digitized-financial-data-analysis-on-screens/58e4b018d2602e5eea34e0a28f961d77/>PikWizard</a>
</span>
</span>
<span class="image-link">
<span
style="margin: 0 0 20px 0; display: inline-block; vertical-align: middle; width: 100%;"
>
<a
target="_blank"
href="https://pikwizard.com/photo/digitized-financial-data-analysis-on-screens/58e4b018d2602e5eea34e0a28f961d77/"
style="text-decoration: none; font-size: 10px; margin: 0;"
>
<img src="https://pikwizard.com/pw/medium/58e4b018d2602e5eea34e0a28f961d77.jpg" style="margin: 0; width: 100%;" alt="" />
<p style="font-size: 12px; margin: 0;">PikWizard</p>
</a>
</span>
</span>
Free (free of charge)
Free for personal and commercial use.
Author: People Creations
Similar Free Stock Images

Premium


Premium


Premium


Premium

Premium


Premium


Premium

Premium


Premium


Premium


Premium


Premium


Premium


Premium


Premium


Premium


Premium


Premium


Premium

Premium


Premium


Premium


Premium


Premium


Premium

Explore More Free Stock Images