- Home >
- Stock Photos >
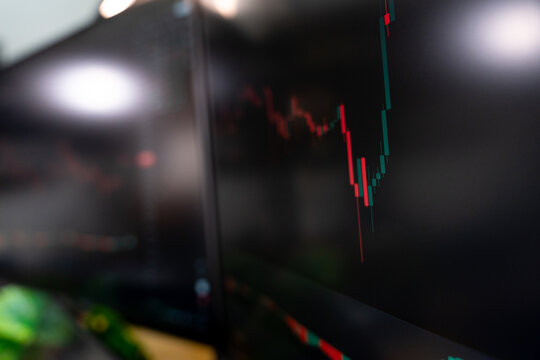
- Dimly Lit Trading Charts on Monitor for Technical Analysis
Dimly Lit Trading Charts on Monitor for Technical Analysis Image
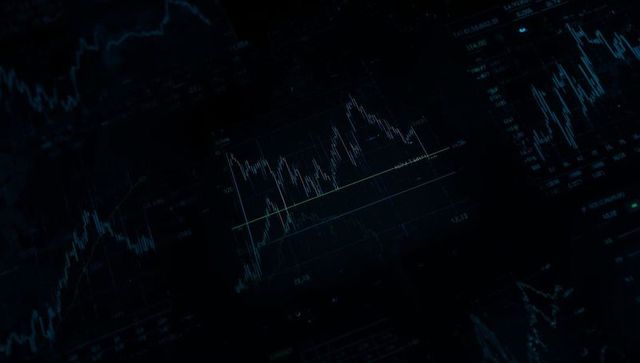
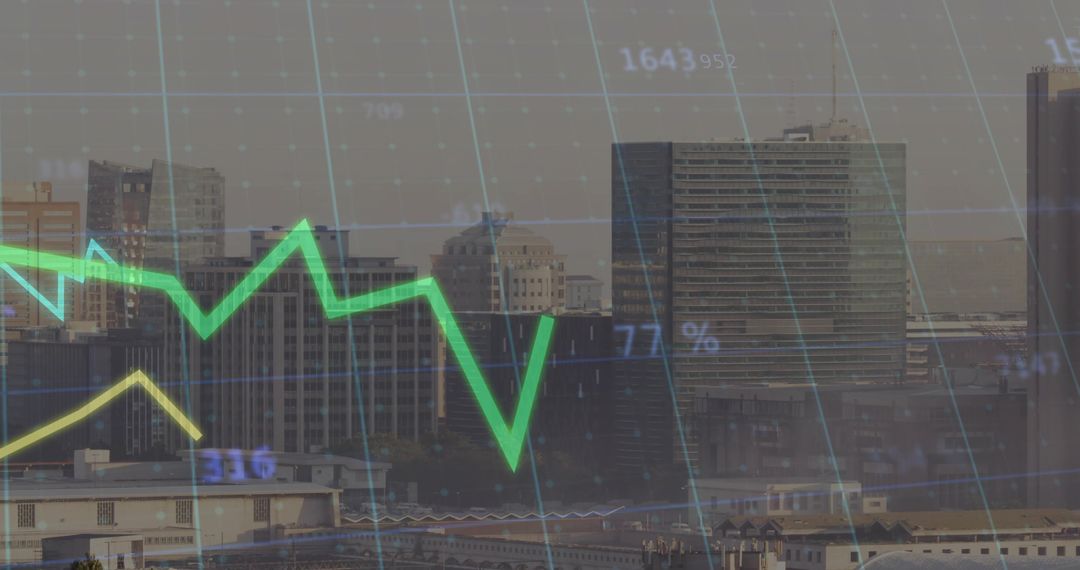
AI Generated Image. Complex financial charts with candlestick and line graphs on low-light trading monitors capture the essence of market trends and technical analysis. Designed for use in financial articles, stock market education material, investment advertising, or presentations on analytics products.
Powered by 


0
downloads
downloads
Tags:
More
Credit Photo
If you would like to credit the Photo, here are some ways you can do so
Text Link
photo Link
<span class="text-link">
<span>
<a target="_blank" href=https://pikwizard.com/photo/dimly-lit-trading-charts-on-monitor-for-technical-analysis/2665233b1caa65f358ad8fad3e957ac5/>PikWizard</a>
</span>
</span>
<span class="image-link">
<span
style="margin: 0 0 20px 0; display: inline-block; vertical-align: middle; width: 100%;"
>
<a
target="_blank"
href="https://pikwizard.com/photo/dimly-lit-trading-charts-on-monitor-for-technical-analysis/2665233b1caa65f358ad8fad3e957ac5/"
style="text-decoration: none; font-size: 10px; margin: 0;"
>
<img src="https://pikwizard.com/pw/medium/2665233b1caa65f358ad8fad3e957ac5.jpg" style="margin: 0; width: 100%;" alt="" />
<p style="font-size: 12px; margin: 0;">PikWizard</p>
</a>
</span>
</span>
Free (free of charge)
Free for personal and commercial use.
Author: AI Creator
Similar Free Stock Images

Premium


Premium


Premium


Premium


Premium


Premium


Premium


Premium


Premium


Premium


Premium


Premium


Premium


Premium


Premium


Premium


Premium


Premium


Premium


Premium


Premium


Premium


Premium


Premium