- Home >
- Stock Photos >
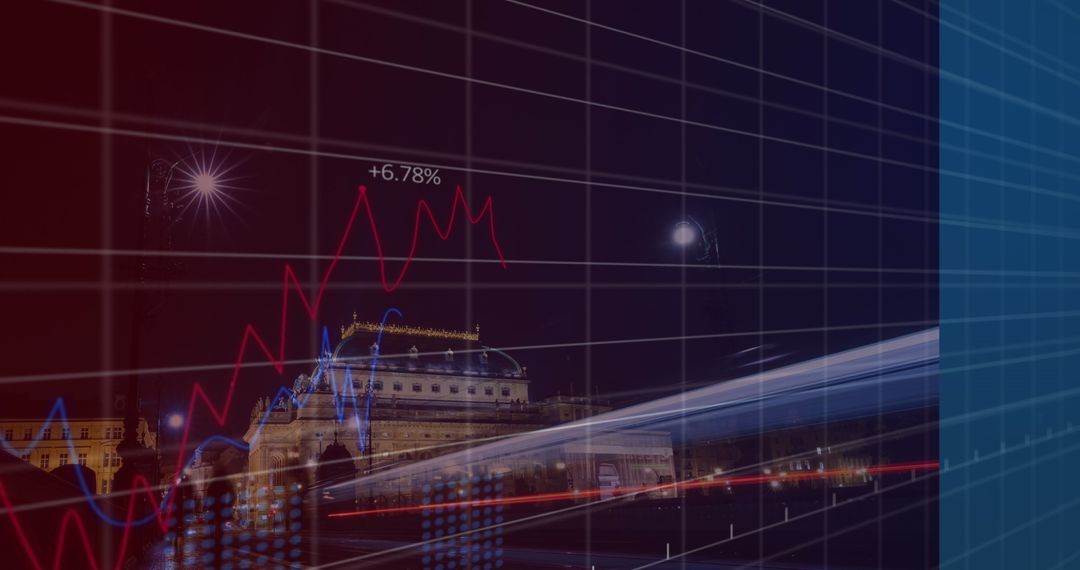
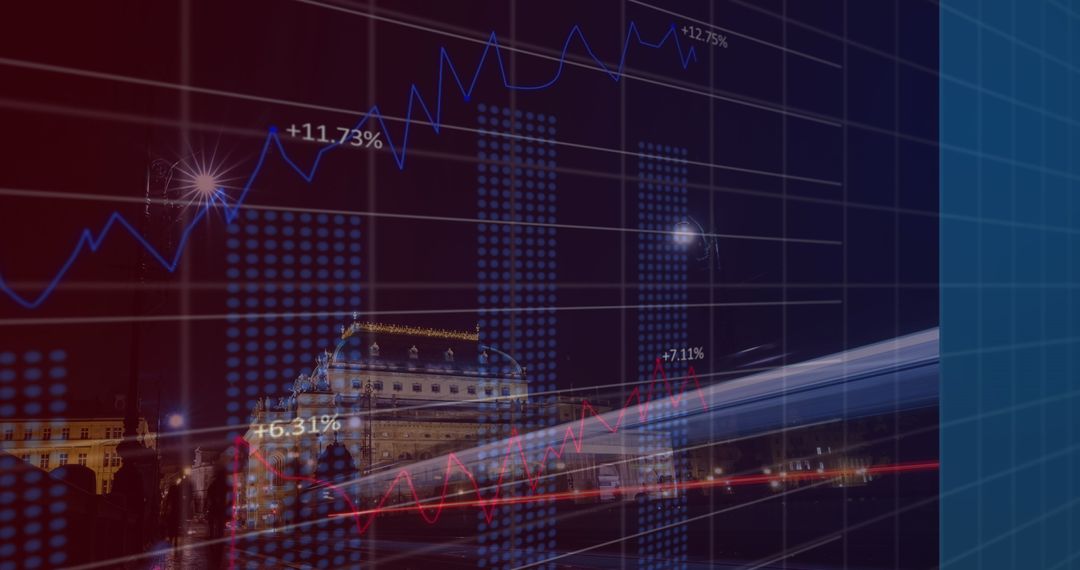
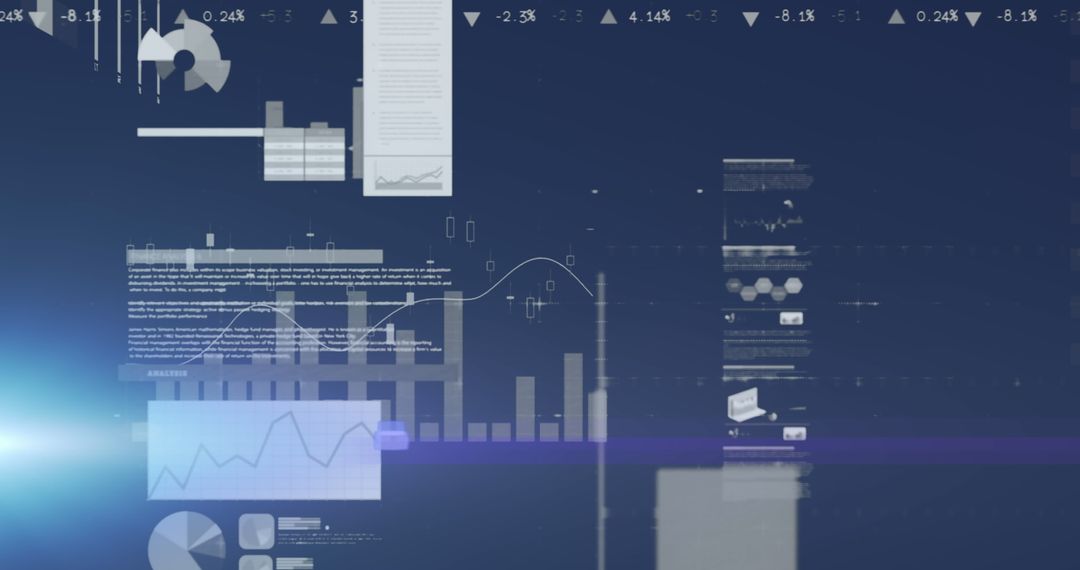
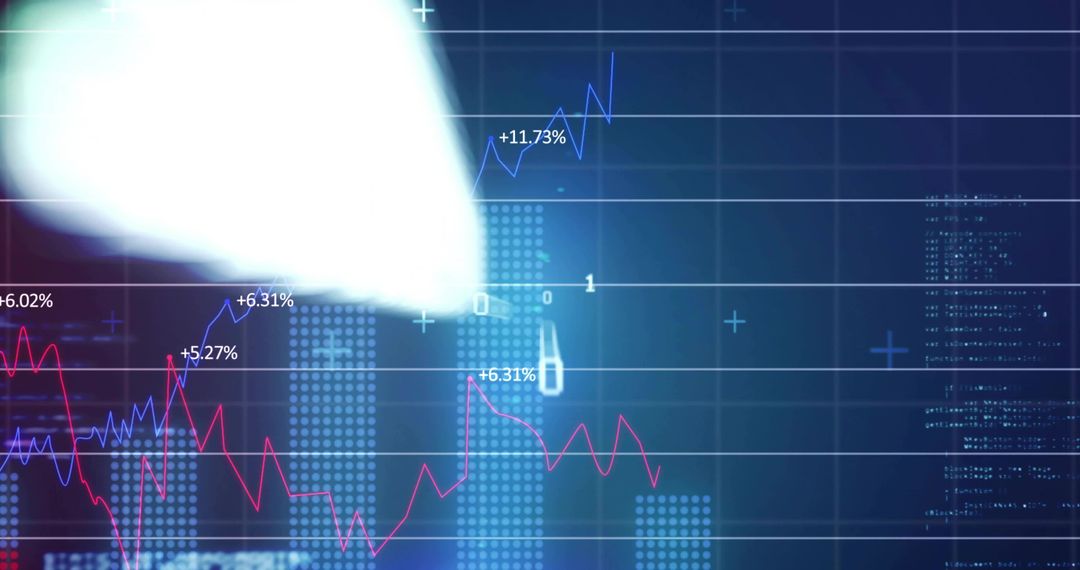
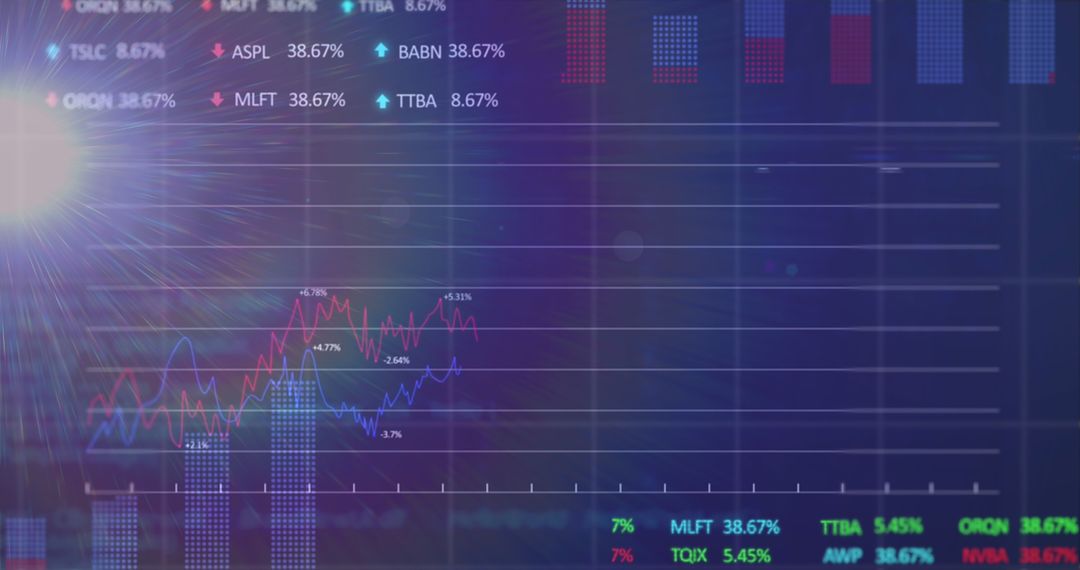
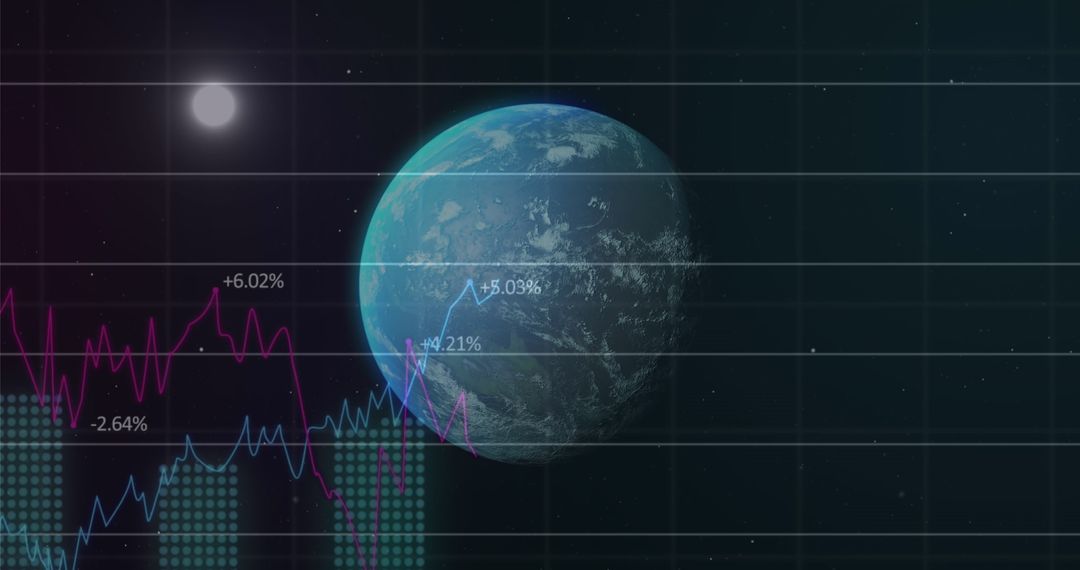
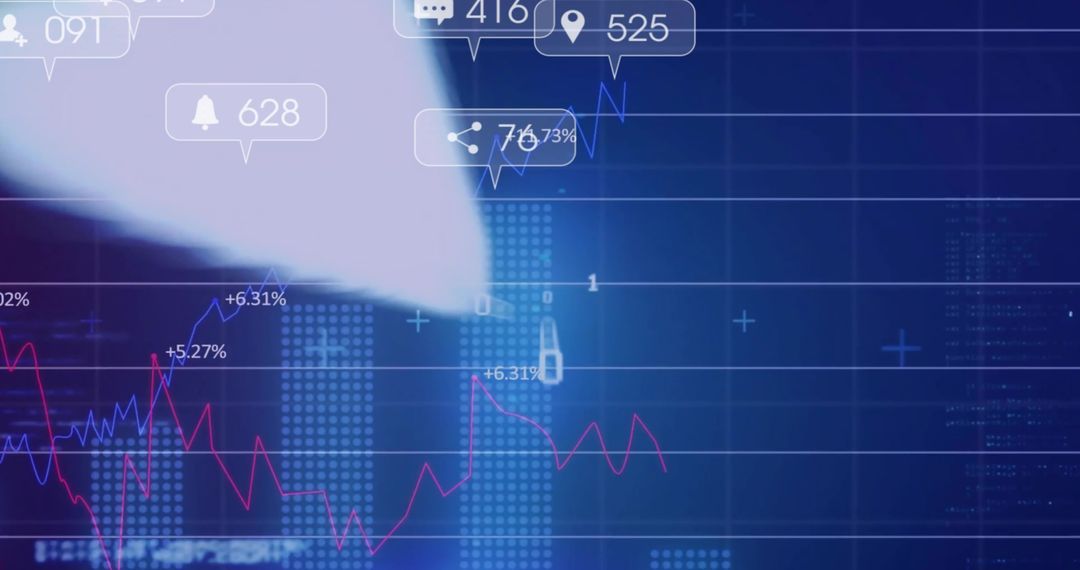
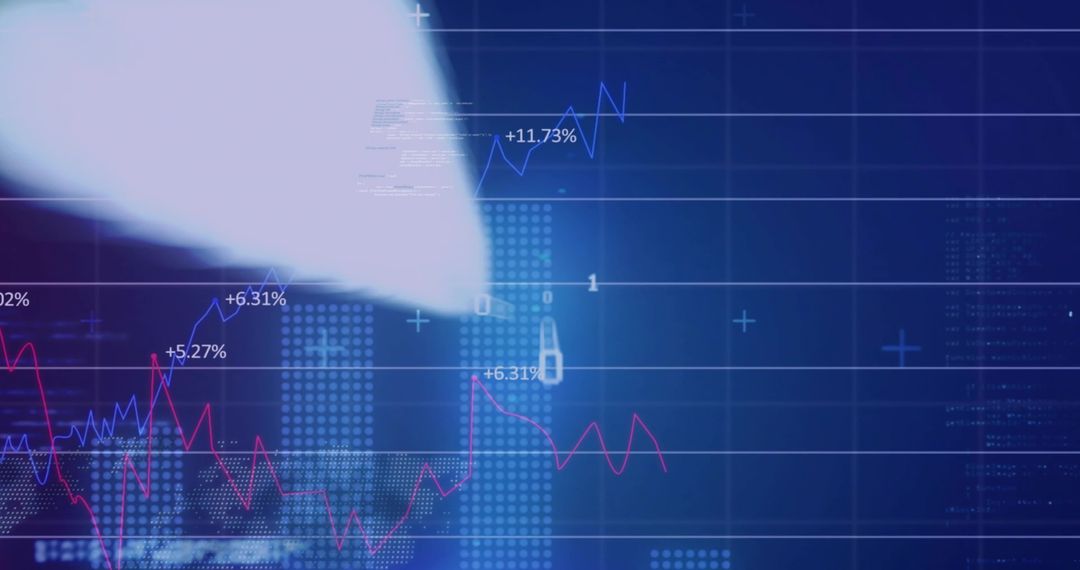
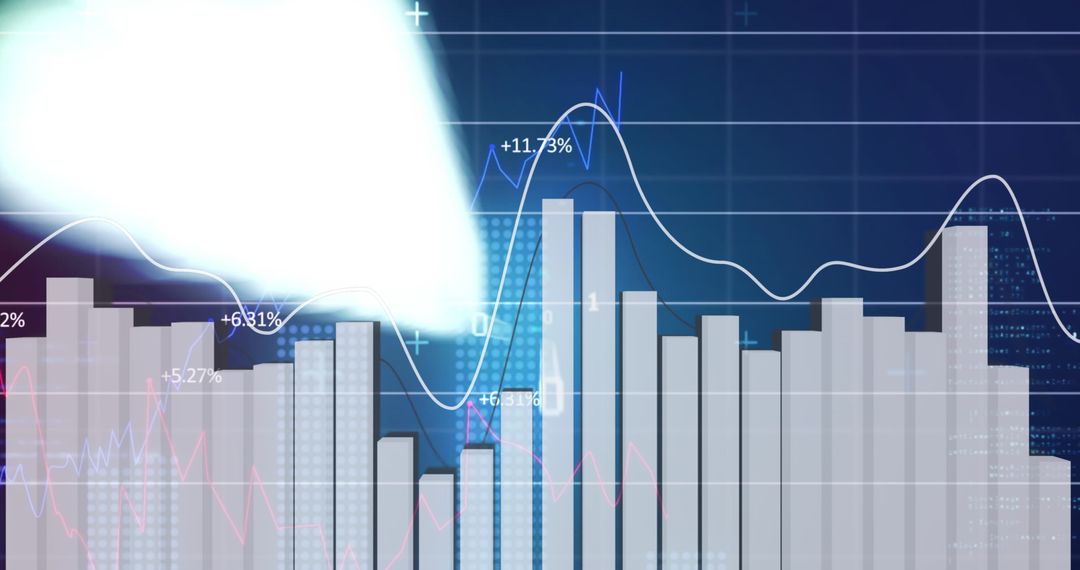
- Displaying Layered Financial Charts Digital Trading Dashboard with Cursor Glare and Percent Labels
Displaying Layered Financial Charts Digital Trading Dashboard with Cursor Glare and Percent Labels Image

Showing layered blue and magenta line graphs over dark blue grid with dotted bar charts, percentage markers, and upward trend labels. Featuring subtle code text and crosshair cursor with lens glare for high-tech trading atmosphere. Helping illustrate market analysis, stock performance, investment growth, and data-driven decision making. Working well as hero banner for fintech website, background for analytics dashboard, illustration for investor report, slide for financial presentation, or social media graphic for market updates. Allowing designers to overlay logos, headlines, or real numbers while maintaining modern tech aesthetic.
Powered by 


0
downloads
downloads
Tags:
More
Credit Photo
If you would like to credit the Photo, here are some ways you can do so
Text Link
photo Link
<span class="text-link">
<span>
<a target="_blank" href=https://pikwizard.com/photo/displaying-layered-financial-charts-digital-trading-dashboard-with-cursor-glare-and-percent-labels/793c006303e316b987f1c1a148c15f3b/>PikWizard</a>
</span>
</span>
<span class="image-link">
<span
style="margin: 0 0 20px 0; display: inline-block; vertical-align: middle; width: 100%;"
>
<a
target="_blank"
href="https://pikwizard.com/photo/displaying-layered-financial-charts-digital-trading-dashboard-with-cursor-glare-and-percent-labels/793c006303e316b987f1c1a148c15f3b/"
style="text-decoration: none; font-size: 10px; margin: 0;"
>
<img src="https://pikwizard.com/pw/medium/793c006303e316b987f1c1a148c15f3b.jpg" style="margin: 0; width: 100%;" alt="" />
<p style="font-size: 12px; margin: 0;">PikWizard</p>
</a>
</span>
</span>
Free (free of charge)
Free for personal and commercial use.
Author: Authentic Images
Similar Free Stock Images

Premium


Premium


Premium


Premium


Premium


Premium


Premium


Premium


Premium


Premium


Premium


Premium


Premium

Premium


Premium


Premium


Premium


Premium


Premium


Premium


Premium


Premium


Premium


Premium