- Home >
- Stock Photos >
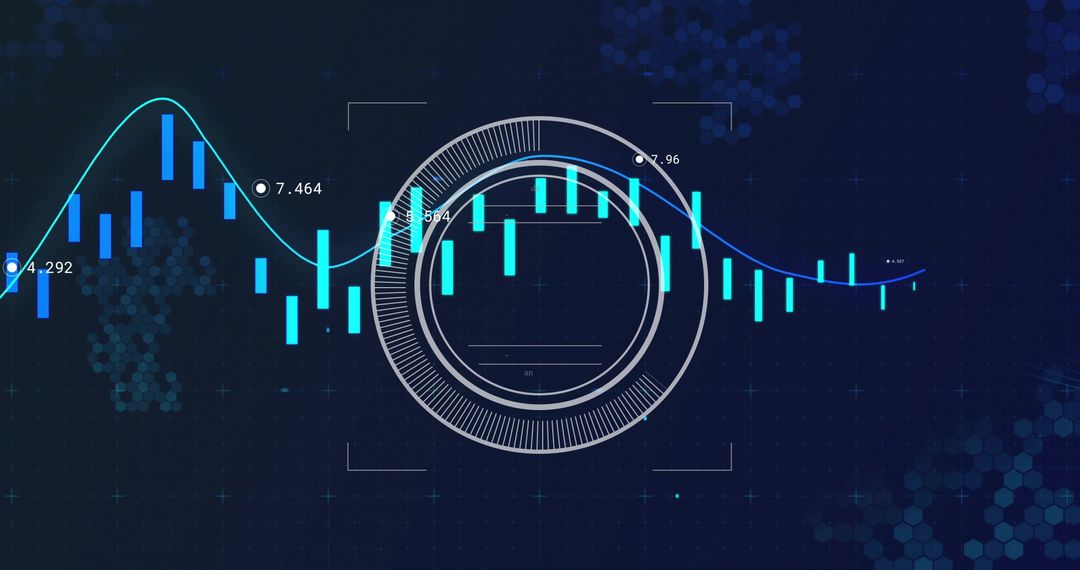
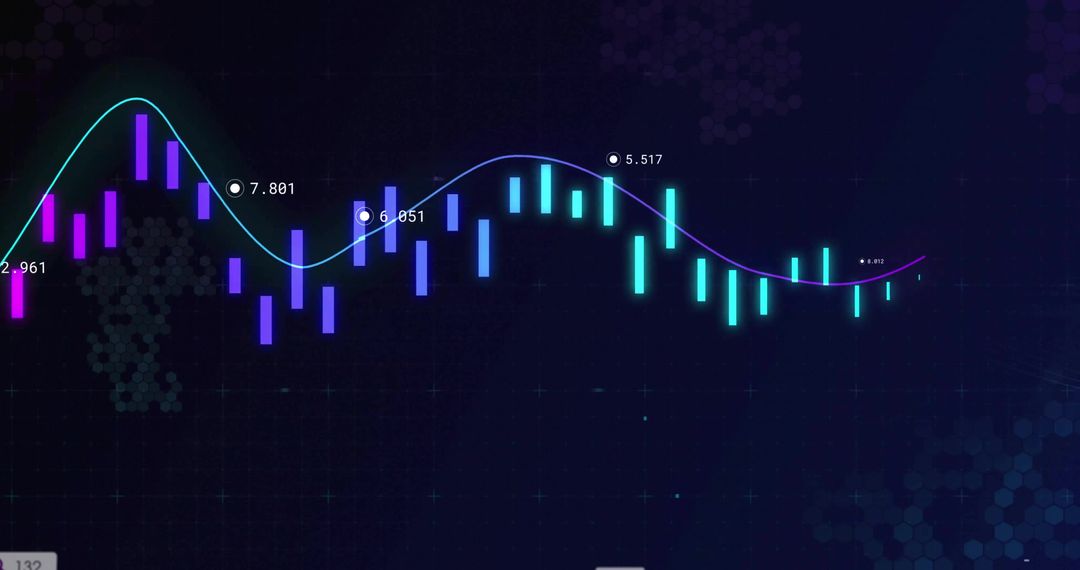
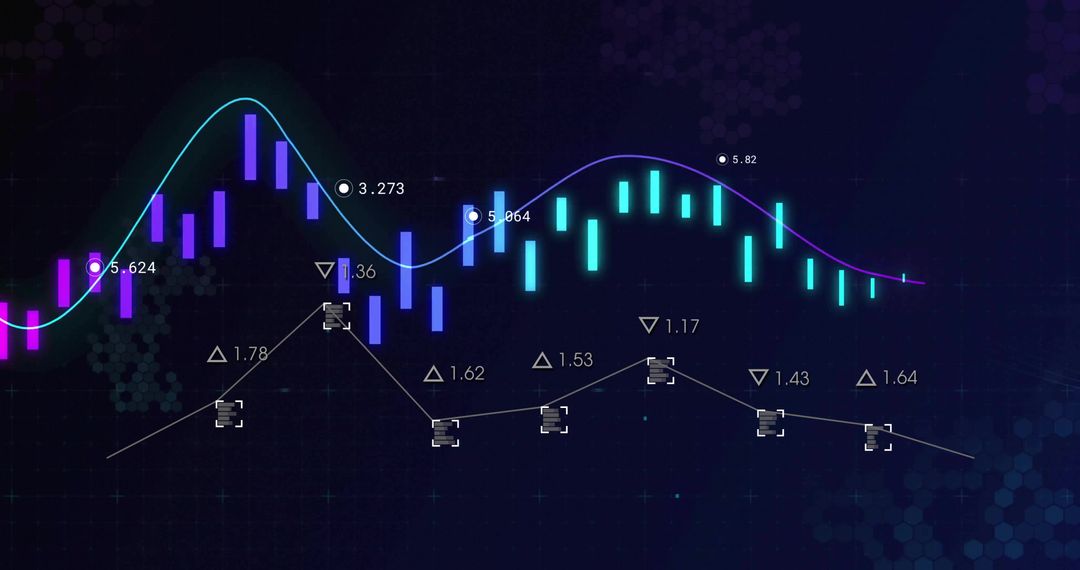
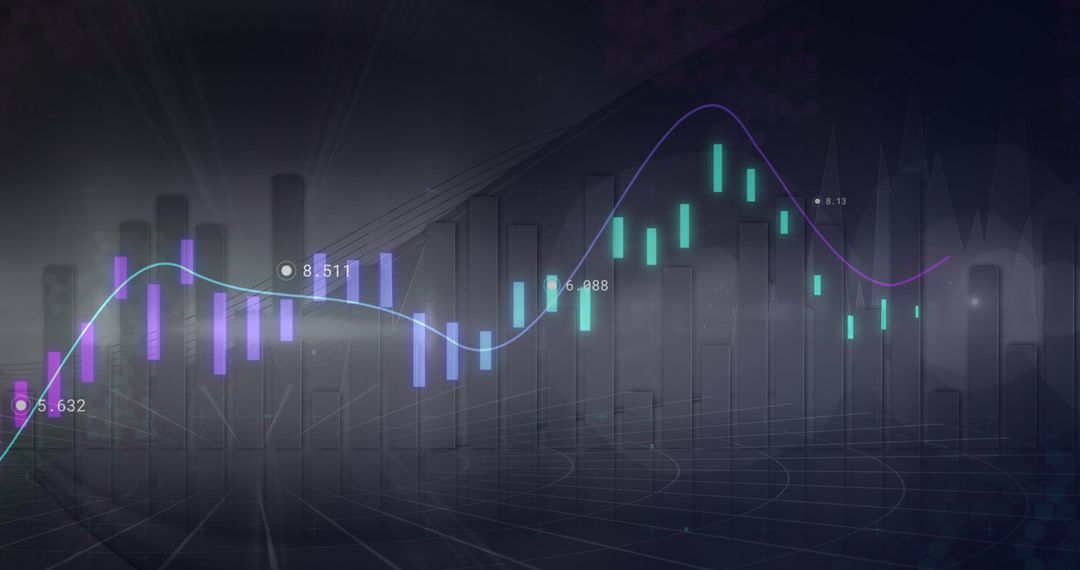
- Displaying Neon Candlestick Chart with Curved Trend Line, Data Markers and Hex Grid
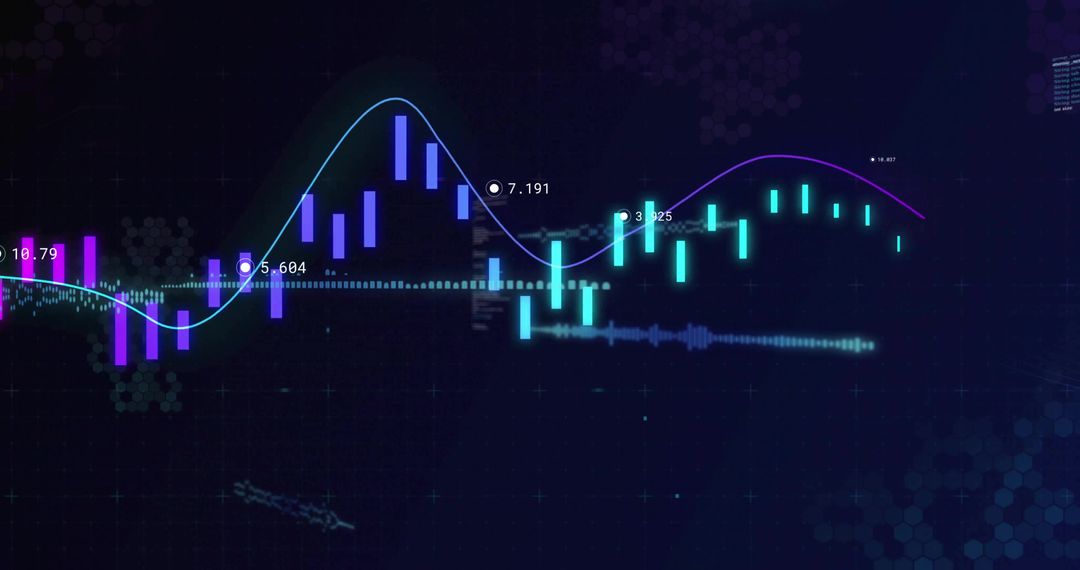
Displaying Neon Candlestick Chart with Curved Trend Line, Data Markers and Hex Grid Image

Showing glowing neon candlestick bars over dark grid with smooth curved trend line and pinpointed numerical markers. Using electric teal, cyan and violet tones for high-contrast futuristic look. Including subtle hexagon honeycomb elements for tech-inspired background and depth. Ideal for financial presentations, fintech websites, trading platform interfaces, blog headers, investor reports, app backgrounds, marketing materials, social media posts, educational content on market analysis. Supporting banner crops and widescreen layouts, recommending left or center text overlay with increased contrast and reduced opacity on chart layer to improve legibility. Communicating volatility, trend identification, technical analysis, algorithmic trading and data-driven storytelling.
Powered by 


0
downloads
downloads
Tags:
More
Credit Photo
If you would like to credit the Photo, here are some ways you can do so
Text Link
photo Link
<span class="text-link">
<span>
<a target="_blank" href=https://pikwizard.com/photo/displaying-neon-candlestick-chart-with-curved-trend-line-data-markers-and-hex-grid/19a321c1aa4ceeacbe5d566237a59f3d/>PikWizard</a>
</span>
</span>
<span class="image-link">
<span
style="margin: 0 0 20px 0; display: inline-block; vertical-align: middle; width: 100%;"
>
<a
target="_blank"
href="https://pikwizard.com/photo/displaying-neon-candlestick-chart-with-curved-trend-line-data-markers-and-hex-grid/19a321c1aa4ceeacbe5d566237a59f3d/"
style="text-decoration: none; font-size: 10px; margin: 0;"
>
<img src="https://pikwizard.com/pw/medium/19a321c1aa4ceeacbe5d566237a59f3d.jpg" style="margin: 0; width: 100%;" alt="" />
<p style="font-size: 12px; margin: 0;">PikWizard</p>
</a>
</span>
</span>
Free (free of charge)
Free for personal and commercial use.
Author: Creative Art
Similar Free Stock Images
Premium


Premium


Premium


Premium


Premium


Premium


Premium


Premium


Premium


Premium


Premium


Premium


Premium


Premium


Premium


Premium


Premium


Premium


Premium


Premium


Premium


Premium


Premium


Premium