- Home >
- Stock Photos >
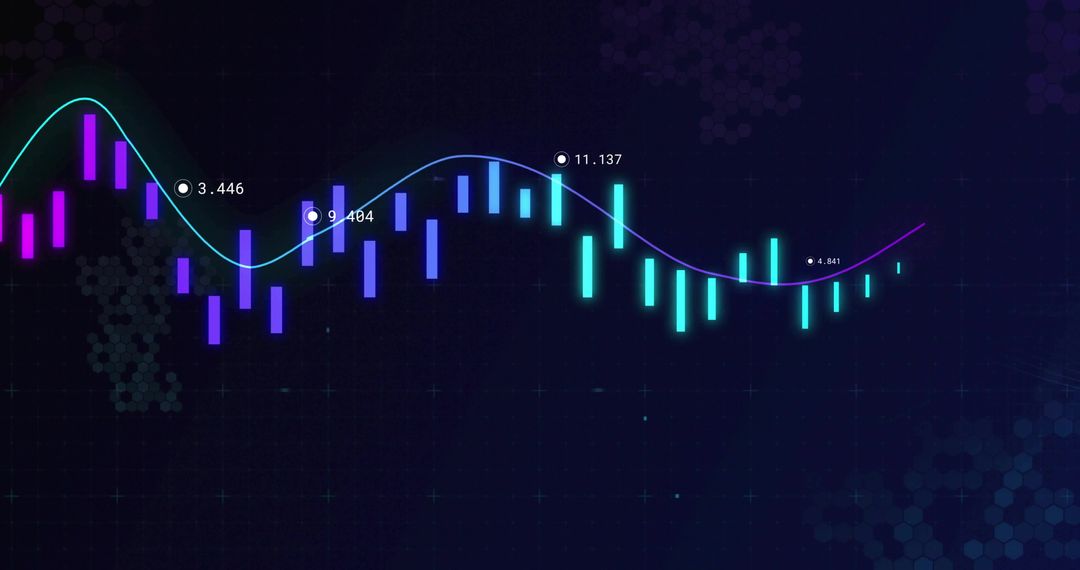
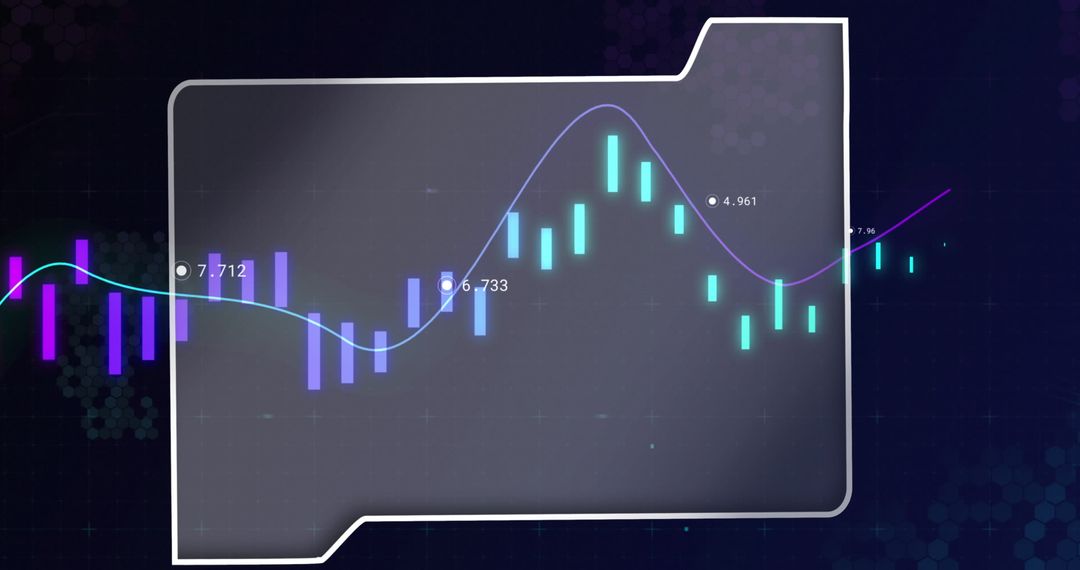
- Displaying Neon Candlestick Chart with Gradient Trend Line, Markers and Particle Cloud
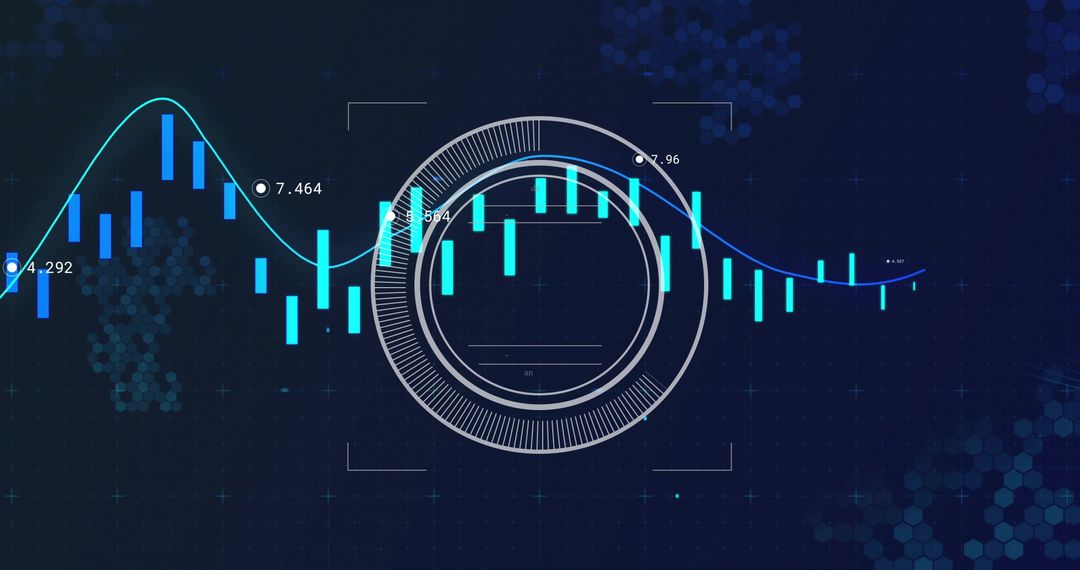
Displaying Neon Candlestick Chart with Gradient Trend Line, Markers and Particle Cloud Image

High-contrast neon candlestick visualization featuring gradient trend line, data markers and dynamic particle cloud. Suiting fintech platforms, trading dashboards, investor presentations, pitch decks and social media campaigns. Helping illustrate market trends, volatility, technical analysis and cryptocurrency performance. Working well as header graphic, report cover, landing page hero, slide background, animated loop or promotional banner. Providing vivid color palette in magenta, cyan and deep blue for futuristic tech branding and on-screen legibility.
Powered by  - Get 15% off with code: PIKWIZARD15


0
downloads
downloads
Tags:
More
Credit Photo
If you would like to credit the Photo, here are some ways you can do so
Text Link
photo Link
<span class="text-link">
<span>
<a target="_blank" href=https://pikwizard.com/photo/displaying-neon-candlestick-chart-with-gradient-trend-line-markers-and-particle-cloud/91a4526fc26c5584aaff5bcf017d9cb3/>PikWizard</a>
</span>
</span>
<span class="image-link">
<span
style="margin: 0 0 20px 0; display: inline-block; vertical-align: middle; width: 100%;"
>
<a
target="_blank"
href="https://pikwizard.com/photo/displaying-neon-candlestick-chart-with-gradient-trend-line-markers-and-particle-cloud/91a4526fc26c5584aaff5bcf017d9cb3/"
style="text-decoration: none; font-size: 10px; margin: 0;"
>
<img src="https://pikwizard.com/pw/medium/91a4526fc26c5584aaff5bcf017d9cb3.jpg" style="margin: 0; width: 100%;" alt="" />
<p style="font-size: 12px; margin: 0;">PikWizard</p>
</a>
</span>
</span>
Free (free of charge)
Free for personal and commercial use.
Author: Creative Art
Similar Free Stock Images

Premium


Premium


Premium


Premium


Premium


Premium


Premium


Premium


Premium


Premium


Premium


Premium


Premium


Premium


Premium


Premium


Premium


Premium


Premium


Premium


Premium


Premium


Premium


Premium