- Home >
- Stock Photos >
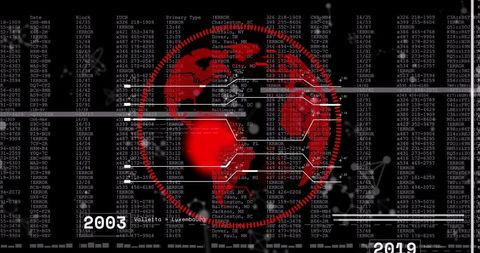
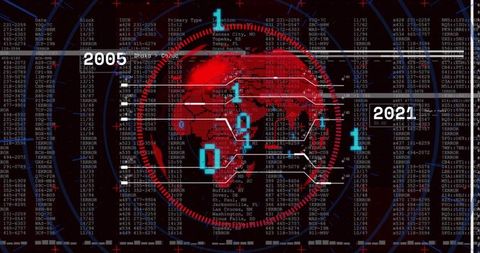
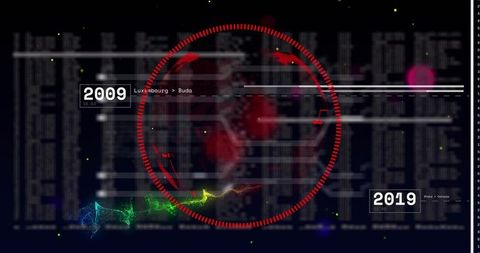
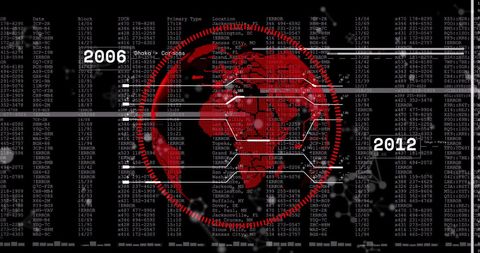
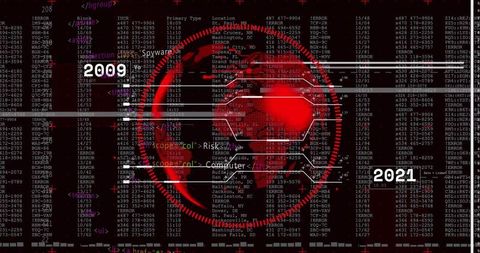
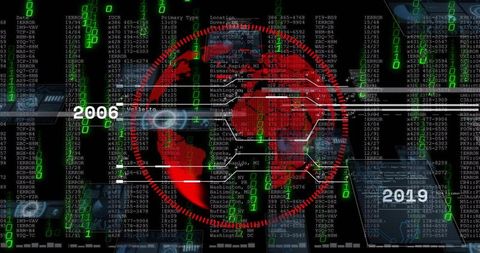
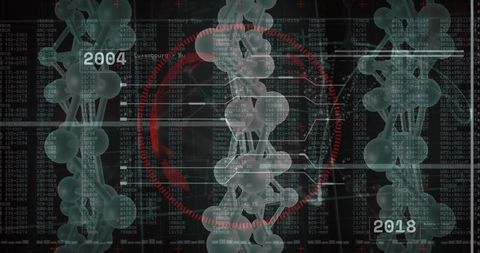
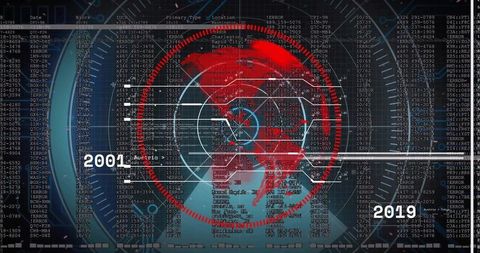
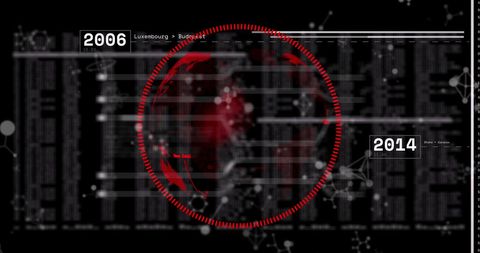
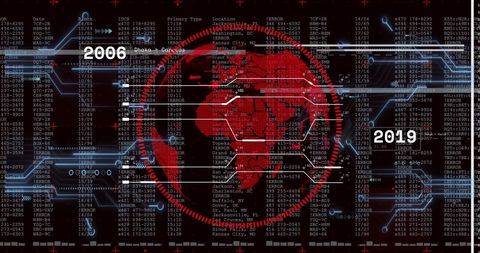
- Displaying red cybersecurity HUD timeline 2004–2019 with ERROR code matrix visualization
Displaying red cybersecurity HUD timeline 2004–2019 with ERROR code matrix visualization Image
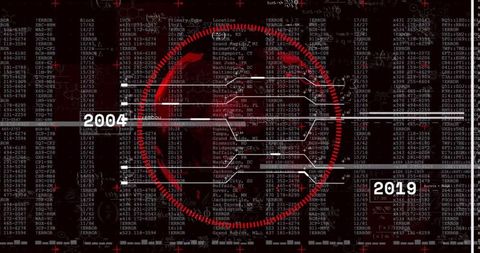
Featuring central red circular HUD over dark code matrix, showing horizontal timeline bars marked 2004 and 2019 and repeated ERROR entries. Including glitch lines, alphanumeric code columns, and subtle skull motif suggesting threat analysis. Using high-contrast red and black palette to convey urgency and danger. Serving as visual asset for cybersecurity and cybercrime stories, data breach reports, incident timeline visuals, forensic analysis slides, threat intelligence dashboards, news graphics, blog headers, social media posts, training materials, UI concept art, and video overlays. Delivering strong focal point for headlines and cover art, and working well for presentation backgrounds and website hero panels.
Powered by 


downloads
Tags:
More
Credit Photo
If you would like to credit the Photo, here are some ways you can do so
Text Link
photo Link
<span class="text-link">
<span>
<a target="_blank" href=https://pikwizard.com/photo/displaying-red-cybersecurity-hud-timeline-20042019-with-error-code-matrix-visualization/01ce10e579525bd15703e2a83d73c2a2/>PikWizard</a>
</span>
</span>
<span class="image-link">
<span
style="margin: 0 0 20px 0; display: inline-block; vertical-align: middle; width: 100%;"
>
<a
target="_blank"
href="https://pikwizard.com/photo/displaying-red-cybersecurity-hud-timeline-20042019-with-error-code-matrix-visualization/01ce10e579525bd15703e2a83d73c2a2/"
style="text-decoration: none; font-size: 10px; margin: 0;"
>
<img src="https://pikwizard.com/pw/medium/01ce10e579525bd15703e2a83d73c2a2.jpg" style="margin: 0; width: 100%;" alt="" />
<p style="font-size: 12px; margin: 0;">PikWizard</p>
</a>
</span>
</span>
Free (free of charge)
Free for personal and commercial use.
Author: Creative Art