
- Home >
- Stock Photos >
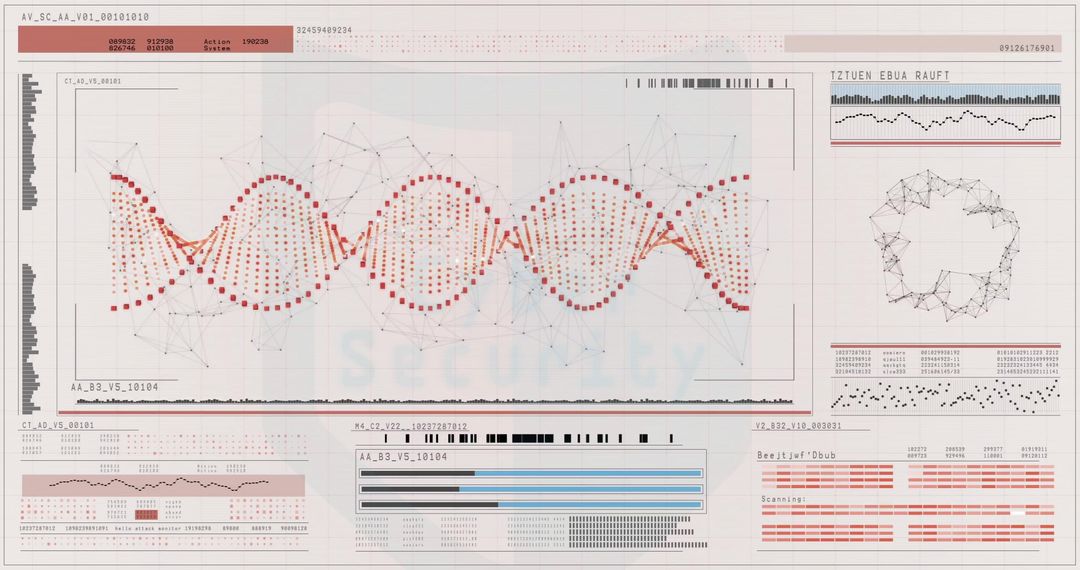
- Dynamic Analytics Dashboard with Engagement Alerts
Dynamic Analytics Dashboard with Engagement Alerts Image

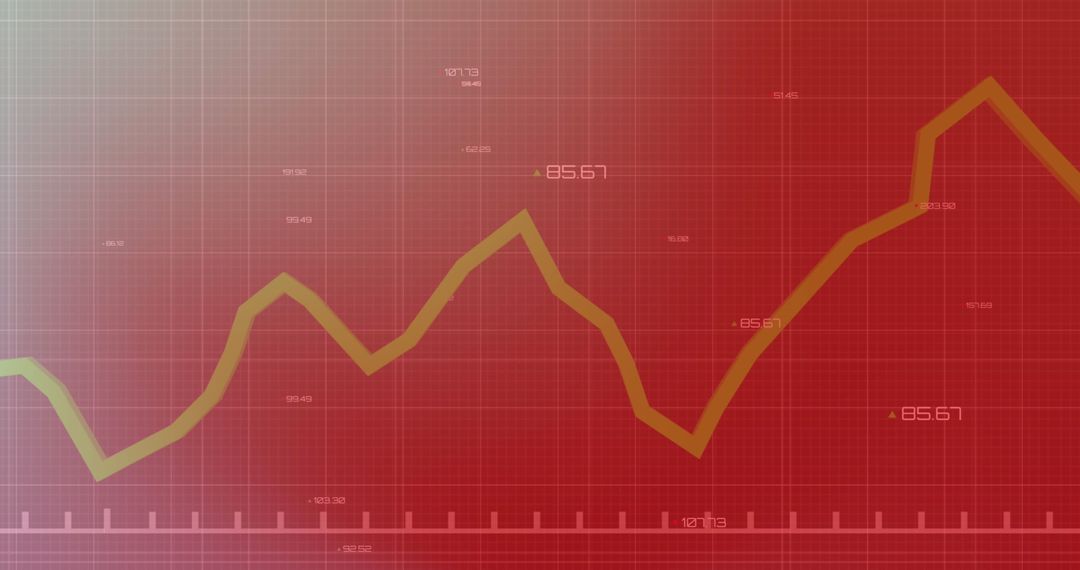
Displaying a digital dashboard with a focus on data trends, this graph combines bar and line data to analyze engagement metrics. Notification badges highlight user interactions such as subscriptions and likes. Useful for business presentations or reports showcasing digital performance and audience analysis in a professional setting.
Powered by  - Get 15% off with code: PIKWIZARD15


0
downloads
downloads
Tags:
More
Credit Photo
If you would like to credit the Photo, here are some ways you can do so
Text Link
photo Link
<span class="text-link">
<span>
<a target="_blank" href=https://pikwizard.com/photo/dynamic-analytics-dashboard-with-engagement-alerts/a695de4bbe3e385f9624d84182001bdd/>PikWizard</a>
</span>
</span>
<span class="image-link">
<span
style="margin: 0 0 20px 0; display: inline-block; vertical-align: middle; width: 100%;"
>
<a
target="_blank"
href="https://pikwizard.com/photo/dynamic-analytics-dashboard-with-engagement-alerts/a695de4bbe3e385f9624d84182001bdd/"
style="text-decoration: none; font-size: 10px; margin: 0;"
>
<img src="https://pikwizard.com/pw/medium/a695de4bbe3e385f9624d84182001bdd.jpg" style="margin: 0; width: 100%;" alt="" />
<p style="font-size: 12px; margin: 0;">PikWizard</p>
</a>
</span>
</span>
Free (free of charge)
Free for personal and commercial use.
Author: Awesome Content
Similar Free Stock Images

Premium


Premium


Premium


Premium


Premium


Premium


Premium


Premium


Premium


Premium


Premium


Premium


Premium


Premium


Premium


Premium


Premium


Premium


Premium


Premium


Premium


Premium


Premium


Premium

