1. Home > 
  2. Stock Photos > 
  3. Dynamic Bar and Line Graph with Data Marker Visualization

Dynamic Bar and Line Graph with Data Marker Visualization Image

Dynamic Bar and Line Graph with Data Marker Visualization

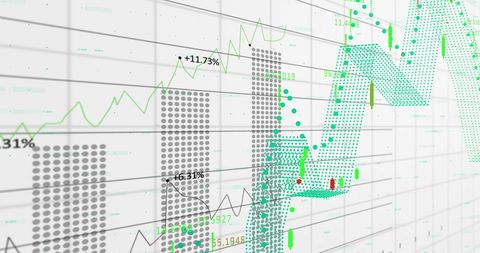
This vibrant illustration prominently showcases a dynamic combination of bar and line graphs, creating a lively visualization of fluctuating financial data with visible markers. Perfect for incorporating into business reports, economic presentations, or articles related to market strategies and financial forecasting - offering a graspable visual impression for financial analytics and data trends.

Powered by Adobe logo
A close-up view of hands on a keyboard with a digital financial chart showing upward trends. This image symbolizes growth and analysis in modern financial markets. Copula - Powered by AdobeThe illustration shows a futuristic digital financial system with glowing displays, microchips, and stacks of currency, representing digital transactions and data processing. - Powered by AdobeSales data analysis dashboard showing performance, trends, and insights. Sales data tracks growth, supports decisions, sales data boosts strategy, and sales data drives performance. - Powered by AdobeFuturistic data center managing big data and financial market analytics - Powered by AdobeBlue-toned image with a circuit diagram overlaying a stock market graph, indicating technological data - Powered by Adobe

Credit Photo

If you would like to credit the Photo, here are some ways you can do so

Free (free of charge)

Free for personal and commercial use.

Author: Authentic Images

Similar Free Stock Images

Soundwave Visualization and Data Analysis on Digital Grid
Premium
A holographic bar chart of financial data emerging from a futuristic black device on a dark background
Dynamic Stock Market Chart with Fluctuating Trends and Data Points
Premium
Digital blue stock market analysis graph showing fluctuation and data processing on screen display.
Premium
Computer screen with a lot of numbers and letters on it. The numbers are in different colors and are arranged in rows. Scene is busy and complex, with a lot of information to process
Dynamic Stock Market Graphs and Financial Data
Data Visualization on Digital Interface with Graphs and Codes
Digital Data Trends Over High-Tech Server Room
Financial Trends Overlaid on Office Desks with Data Points
Premium
Robotic hand manipulating financial data
Rising Financial Data Graph on Digital Grid Background
Abstract Financial Growth Visualization with City Background
Digital Financial Data and Global Business Analytics
Rising Graphs and Interactive Financial Data Analytics Background
Abstract Financial Data Analysis and Global Business Concept
Digital Data Analytics Overlay on Cityscape
Premium
Colorful 3d pie chart graphic displaying data distribution and market share, financial statistics visualization with transparent background
Financial Data Analysis with Declining Trends
Financial Data Visualization in Server Room Setting
Financial Data and Graphs on Digital Screen
Dynamic Data Visualization with Financial Charts and 3D Elements
Premium
Abstract blue illustration of financial data charting with connected lines, dark background
European Market Data Overlay with EU Flag and Financial Graphs
Premium
Futuristic data visualization showing financial market trend with dynamic glowing lines
Financial Growth Graph and Data Analytics Representation
Financial Data Flow against Urban Skyline Backdrop
Financial Data Streaming with Arrows Over Graphic Indicators
Dynamic Financial Data Overlaid on Grid Background
Premium
Financial Data Display: An abstract view of financial data, with complex charts and illuminated panels, suggesting intricate processing and digital information.
Global Financial Data and Analytics Overlay
Financial Data Statistics Visualized in Urban Setting
Dynamic Business Data and Cityscape Visualization
Financial Growth Statistic Data Processing Over Urban Cityscape
World Map with Falling Line Graphs Indicating Global Economic Decline
Dynamic Forex Trading Graphs with Increasing Numbers
Digital Financial Data with Graph and Grid Patterns
Digital Stock Market Green Graph Against Dark Trading Board
Premium
Machine learning finance performance metrics gear data technology cog concept analytics economy gently gear digital stock market chart background
Premium
Utility Bills to Stock Assets Transformation Concept with Digital Funnel and Graphs process smart utilities
Premium
Digital data processing with financial market analytics and statistics
Digital Financial Data Overlay on Urban Street Scene
Financial Stock Market Trends Over Digital Grid Background
Digital Finance Data Overlaying Futuristic Cityscape
Abstract Financial Data Processing and Analysis Interface
Visualizing financial analytics with red and blue line charts, percent metrics and code overlay
Dynamic Digital Market Analysis with Holographic Data
Financial Data Analysis with Growing Stock Trends
Data Processing Visualization with Code and Graphs
Dynamic Data Processing Concept in Digital Interface Design
Premium
Abstract financial chart with vibrant data points.  Dynamic  fluctuation, showing market movement
Dynamic Financial Data Display in Digital Space
Digital Finance Data Overload with Code and Graphs
Financial Data Visualization on World Map with Graph Analytics
Premium
AI technology represented by a holographic cube on a computer chip, with financial market data in the background.
Dynamic Financial Charts and Graphs Indicating Market Trends
Digital Finance Network with User Profiles and Graphs
Global Financial Technology Network and Data Analytics
Data Processing Digital Interface with Coding Overlay
Premium
Business growth and data analysis concepts illustrated in a notebook
Dynamic Business Analysis with Global Digital Interface Figures
Digital Data Analysis Interface with Graphs and Scope
Dynamic Stock Market Data Analysis With Graphs and Percentages
Dynamic Financial Growth Digital Chart Display
Financial Data Displayed Over City Skyline with Rising Graphs
Premium
Futuristic robot advisor head in profile faces digital screen. Shows complex financial data, stock market charts, investment graphs. Artificial intelligence cyborg analyzes global trends. Machine
Digital Data Visualization with Trend Lines and Percentage Changes
Global Network Connectivity and Data Processing on World Map
Digital Cityscape with Financial Data Overlay
Dynamic Digital Stock Market Ticker with Growing Graph Trends
Dynamic Statistical Data Analysis on Digital Grid Network
Dynamic Stock Market Trends with Graphs on Digital Display
Global Digital Interface with Data Points and Connectivity
Digital Financial Data Analysis on Grid Framework
Abstract Financial Market Data with CGI and Code Overlay
Dynamic Financial Data with Overlaid Cityscape Interface
Futuristic Dashboard Interface with Digital Hologram and Coding Elements
Statistical Data Processing with Graph Overlay on Buildings
Holographic Financial Graph with Dynamic Line Chart
Abstract Digital Charts with Social Media Metrics Rising
Premium
Abstract digital data visualization of a glowing financial market chart
Digital Financial Data Trends and Analytics Conceptual Background
Dynamic Digital Data Analysis on Elevated Grid
Digital Visualization of Global Networking with Statistical Graphs
Abstract Financial Chart Showing Upward Trend in Global Market
Green Line Rising on Digital Trading Board with Abstract Background
Holographic Charts with Social Media Notifications
Dynamic Statistical Data Analysis with Gradient Colors
Data Processing and Analytics in a Global Business Context
Premium
Artificial Intelligence and Robotic Market Share Data Analysis Concept for Website Banner
Digital Financial Data Analysis with Graphs and Stock Market Trends
Dynamic Green Stock Chart on Digital Grid Background
Financial Chart and Rotating Globe on Digital Grid Background
Financial Data Analysis with Global Digital Interface
Premium
Digital data analyzing financial market charts with neon lights
Dynamic Financial Data Visualization on Digital Grid Background
Financial Analysis Dashboard Overlay on Modern Office Workspace
Eco-Friendly Icons Overlaid on Rising Stock Market Graph
Digital Data Visualization with World Map and Graphs
Dynamic Graphic of Financial Data Displayed on Graph
Digital Finance: Modern Stock Market Analysis Display
Digital Stock Market Trends and Financial Growth Analysis
Financial Graphs with Social Media Analytics on Digital Chart
Data Analytics Graphs on Digital Interface Background
Digital Interface Display Over Urban Skyline for Financial Analytics
Digital Interface with Virtual Data Surging Across Connection Globes
Premium
Magnified fingerprint on financial data
Premium
Business growth concept with rising arrow and gear icons showing teamwork and process efficiency.
Premium
A team of financial analysts works through the night in a fast-paced firm, processing market data, reviewing performance reports, and executing trades to manage investment portfolios.
Premium
Artificial intelligence chip enables fast data transmission and energy trading using advanced technology for efficient processing
Digital Data and Financial Charts on White Background
Dynamic Financial Data Displays Stock Market Trends
Advanced Data Processing with Graphs and Futuristic Network Overlay
Financial Data Visualization Over Futuristic Cityscape
Premium
A business professional focuses on a laptop with a financial growth graph overlay, indicating positive trends and market analysis. Ideal for finance and business themes. Copula
Rising Digital Graph and Data Visualizations on Black Background
Cybernetic Data Flow with Digital Network Connections
Futuristic Keyboard Analytics Display with Digital Graphs and Numbers
Financial Graphs Overlaying Industrial Junkyard
Premium
Businessman hand arranging wood block stacking as step stair with arrow up, world map and graph. Business growth success process concept.
Colorful Data Analytics Display on Dark Background
Financial Data Charts in Shimmering Blue Digital Space
Financial Data Overlay on Urban Skyscrapers
Overlay of Financial Data on Business People in Office Building
Premium
Financial data charts and graphs showcasing market analysis and business analytics
Digital DNA Strand Visualization on Modern Interface Background
Explore More Free Stock Images