- Home >
- Stock Photos >
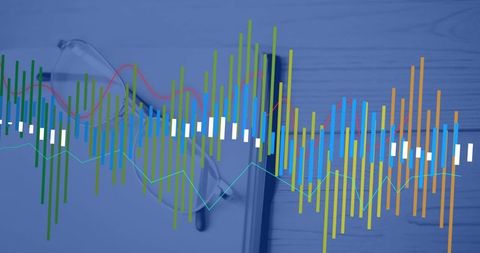
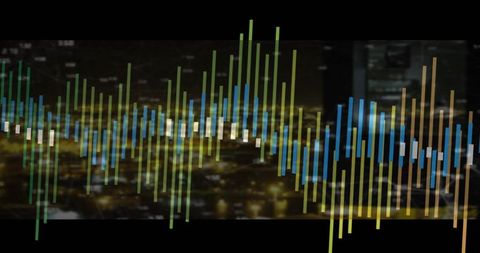
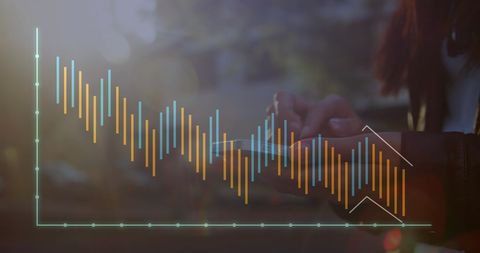
- Dynamic Bars Overlapping Graph in Financial Analysis
Dynamic Bars Overlapping Graph in Financial Analysis Image

Abstract graphic design encapsulating the analytical nature of finance. Dynamic, colorful bars interact with digital projections and charts, perfect for illustrating economic reports, tech discussions, or business analytics content. Effective in enhancing informative presentations and digital marketing in the finance sector.

downloads
Tags:
More
Credit Photo
If you would like to credit the Photo, here are some ways you can do so
Text Link
photo Link
<span class="text-link">
<span>
<a target="_blank" href=https://pikwizard.com/photo/dynamic-bars-overlapping-graph-in-financial-analysis/08e728f638511387e0ad74c538cc0796/>PikWizard</a>
</span>
</span>
<span class="image-link">
<span
style="margin: 0 0 20px 0; display: inline-block; vertical-align: middle; width: 100%;"
>
<a
target="_blank"
href="https://pikwizard.com/photo/dynamic-bars-overlapping-graph-in-financial-analysis/08e728f638511387e0ad74c538cc0796/"
style="text-decoration: none; font-size: 10px; margin: 0;"
>
<img src="https://pikwizard.com/pw/medium/08e728f638511387e0ad74c538cc0796.jpg" style="margin: 0; width: 100%;" alt="" />
<p style="font-size: 12px; margin: 0;">PikWizard</p>
</a>
</span>
</span>
Free (free of charge)
Free for personal and commercial use.
Author: Awesome Content