
- Home >
- Stock Photos >
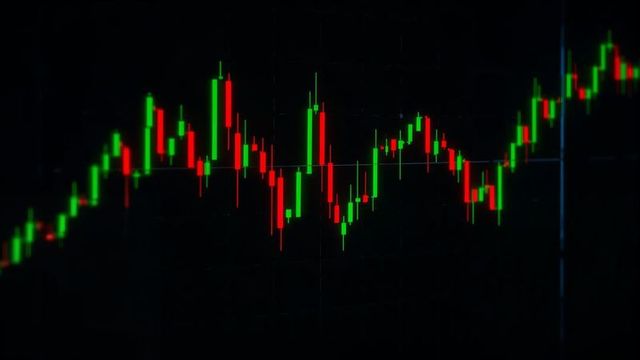
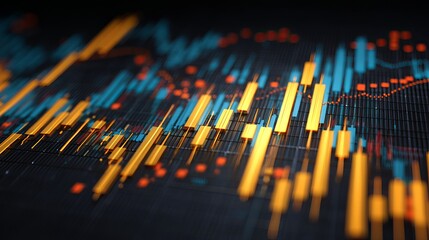
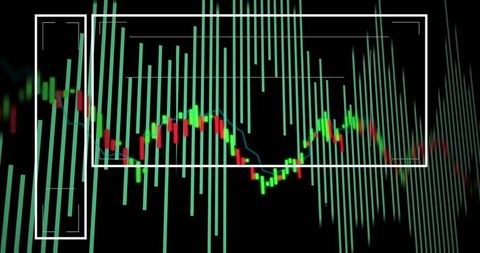
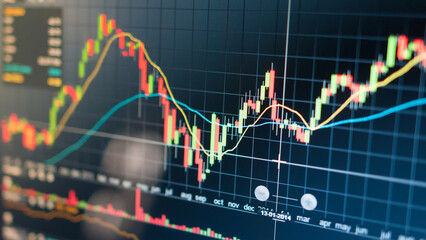
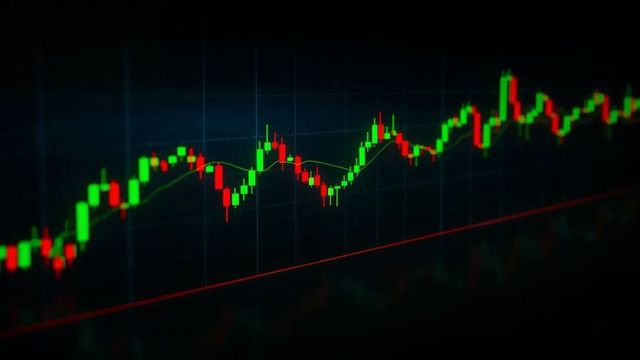
- Dynamic Candlestick Chart on Black Background
Dynamic Candlestick Chart on Black Background Image
AI
AI Generated Image. Captivating depiction of a candlestick chart showing financial trends on a black background. Green and red bars represent fluctuating prices in stock trading, conveying a sense of market dynamics. This stock imagery could be used to illustrate financial analyses, support articles related to trading software, or power visual resources on investment education platforms. Ideal for websites exploring financial analysis, market trends, or courses teaching trading fundamentals.
Powered by 


downloads
Tags:
More
Credit Photo
If you would like to credit the Photo, here are some ways you can do so
Text Link
photo Link
<span class="text-link">
<span>
<a target="_blank" href=https://pikwizard.com/photo/dynamic-candlestick-chart-on-black-background/20ffab52df3707be5c65a055bd08966a/>PikWizard</a>
</span>
</span>
<span class="image-link">
<span
style="margin: 0 0 20px 0; display: inline-block; vertical-align: middle; width: 100%;"
>
<a
target="_blank"
href="https://pikwizard.com/photo/dynamic-candlestick-chart-on-black-background/20ffab52df3707be5c65a055bd08966a/"
style="text-decoration: none; font-size: 10px; margin: 0;"
>
<img src="https://pikwizard.com/pw/medium/20ffab52df3707be5c65a055bd08966a.jpg" style="margin: 0; width: 100%;" alt="" />
<p style="font-size: 12px; margin: 0;">PikWizard</p>
</a>
</span>
</span>
Free (free of charge)
Free for personal and commercial use.
Author: AI Creator
Similar Free Stock Images

Premium


Premium


AI


Premium
Premium


Premium


Premium


Premium


Premium


Premium

Premium


Premium
AI


Premium
AI


Premium


Premium


Premium


Premium

AI

Premium


Premium


Premium

Premium


AI
Premium


Premium


AI
Premium


Premium


Premium

Explore More Free Stock Images