- Home >
- Stock Photos >
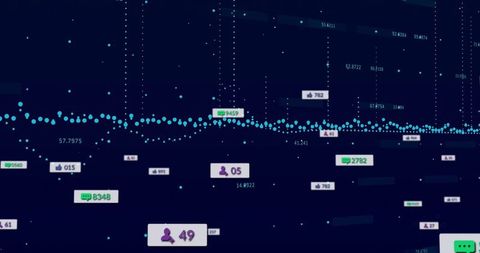
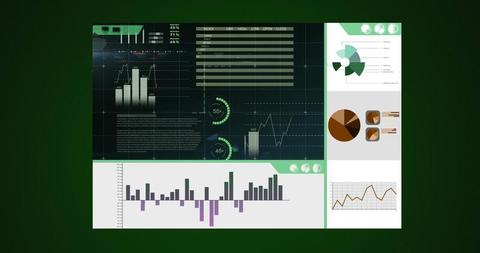
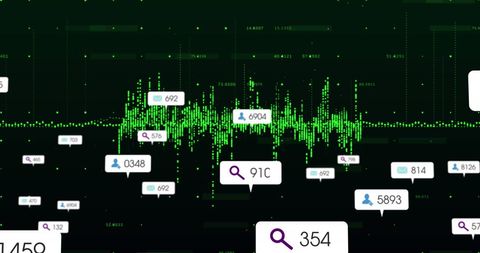
- Dynamic Data Analytics on Digital Interface with Green Waveform Graph
Dynamic Data Analytics on Digital Interface with Green Waveform Graph Image
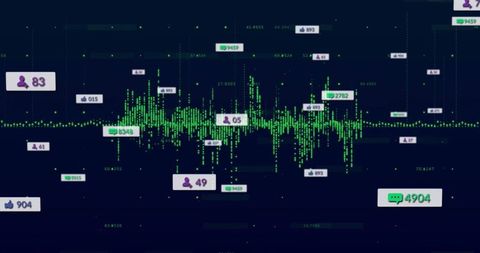
A visually striking representation of a dynamic data analytics dashboard displayed on a dark navy grid background. Green waveform visualizes real-time data fluctuations accompanied by various metric labels such as '83', '49', and comment or satisfaction icons. This image communicates modern technological advancements in digital analytics and visualization tools, making it ideal for use in articles, blogs, presentations, and reports focused on data science, technology integration in business, innovative data monitoring solutions, and digital transformation strategies.

downloads
Tags:
More
Credit Photo
If you would like to credit the Photo, here are some ways you can do so
Text Link
photo Link
<span class="text-link">
<span>
<a target="_blank" href=https://pikwizard.com/photo/dynamic-data-analytics-on-digital-interface-with-green-waveform-graph/6dd31e452effdf135e080f57fccbfb2d/>PikWizard</a>
</span>
</span>
<span class="image-link">
<span
style="margin: 0 0 20px 0; display: inline-block; vertical-align: middle; width: 100%;"
>
<a
target="_blank"
href="https://pikwizard.com/photo/dynamic-data-analytics-on-digital-interface-with-green-waveform-graph/6dd31e452effdf135e080f57fccbfb2d/"
style="text-decoration: none; font-size: 10px; margin: 0;"
>
<img src="https://pikwizard.com/pw/medium/6dd31e452effdf135e080f57fccbfb2d.jpg" style="margin: 0; width: 100%;" alt="" />
<p style="font-size: 12px; margin: 0;">PikWizard</p>
</a>
</span>
</span>
Free (free of charge)
Free for personal and commercial use.
Author: Creative Art