
- Home >
- Stock Photos >
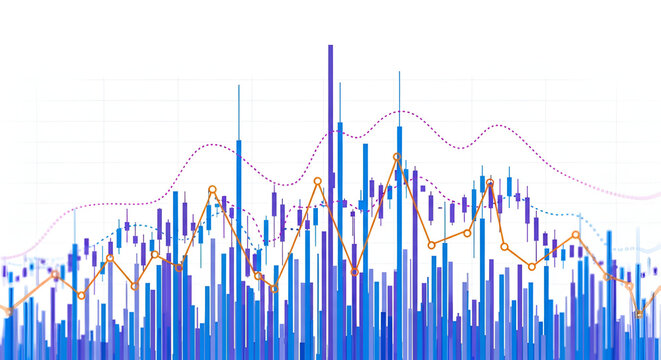
- Dynamic Data Display with Bars and Lines on Grid Background
Dynamic Data Display with Bars and Lines on Grid Background Image

Intricate chart showing financial statistics through colorful bars and dynamic lines against a grid background represents modern data processing and analysis. Useful for business presentations, financial reports, and articles related to market trends and economics. Excellent for illustrating concepts in global business and finance sectors.
Powered by 


downloads
Tags:
More
Credit Photo
If you would like to credit the Photo, here are some ways you can do so
Text Link
photo Link
<span class="text-link">
<span>
<a target="_blank" href=https://pikwizard.com/photo/dynamic-data-display-with-bars-and-lines-on-grid-background/bfcfdf61c4bc41f0d6e354b6de6b4b89/>PikWizard</a>
</span>
</span>
<span class="image-link">
<span
style="margin: 0 0 20px 0; display: inline-block; vertical-align: middle; width: 100%;"
>
<a
target="_blank"
href="https://pikwizard.com/photo/dynamic-data-display-with-bars-and-lines-on-grid-background/bfcfdf61c4bc41f0d6e354b6de6b4b89/"
style="text-decoration: none; font-size: 10px; margin: 0;"
>
<img src="https://pikwizard.com/pw/medium/bfcfdf61c4bc41f0d6e354b6de6b4b89.jpg" style="margin: 0; width: 100%;" alt="" />
<p style="font-size: 12px; margin: 0;">PikWizard</p>
</a>
</span>
</span>
Free (free of charge)
Free for personal and commercial use.
Author: People Creations
Similar Free Stock Images

Premium


Premium

Premium


Premium

Premium


Premium


Premium


Premium

Premium


Premium


Premium


Premium


Premium


Premium


Premium


Premium


Premium

Premium


Premium


Premium


Premium


Premium


Premium


Premium


Premium

Explore More Free Stock Images