
- Home >
- Stock Photos >
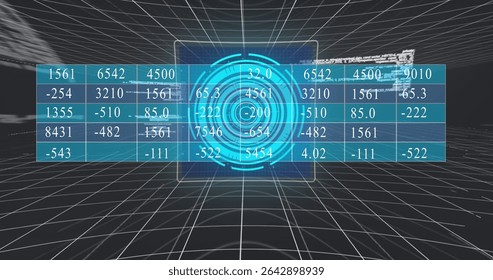
- Dynamic Data Flow Over Digital Graphical Interface
Dynamic Data Flow Over Digital Graphical Interface Image

Glowing lines dynamically moving over a multi-layered graph depicting data visualization and modern digital analytics. Perfect for illustrating concepts of financial data analysis, technology advancements in data processing, or presentations on future trends in computing. Ideal for use in tech blogs, business analytics articles, or innovation-themed advertisements.
Powered by  - Get 15% off with code: PIKWIZARD15


downloads
Tags:
More
Credit Photo
If you would like to credit the Photo, here are some ways you can do so
Text Link
photo Link
<span class="text-link">
<span>
<a target="_blank" href=https://pikwizard.com/photo/dynamic-data-flow-over-digital-graphical-interface/1a4a5b6735406687cf05217c938964d0/>PikWizard</a>
</span>
</span>
<span class="image-link">
<span
style="margin: 0 0 20px 0; display: inline-block; vertical-align: middle; width: 100%;"
>
<a
target="_blank"
href="https://pikwizard.com/photo/dynamic-data-flow-over-digital-graphical-interface/1a4a5b6735406687cf05217c938964d0/"
style="text-decoration: none; font-size: 10px; margin: 0;"
>
<img src="https://pikwizard.com/pw/medium/1a4a5b6735406687cf05217c938964d0.jpg" style="margin: 0; width: 100%;" alt="" />
<p style="font-size: 12px; margin: 0;">PikWizard</p>
</a>
</span>
</span>
Free (free of charge)
Free for personal and commercial use.
Author: Authentic Images
Similar Free Stock Images

Premium


Premium

Premium


Premium


Premium


Premium


Premium


Premium


Premium

Premium

Premium


Premium


Premium


Premium


Premium


Premium


Premium


Premium


Premium


Premium


Premium

Premium


Premium


Premium


Premium


Explore More Free Stock Images