- Home >
- Stock Photos >
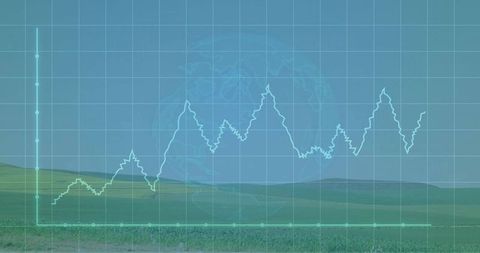
- Dynamic Data Flow with Analytics Visuals on Grid
Dynamic Data Flow with Analytics Visuals on Grid Image

Abstract digital representation of shifting data lines and numeric indicators overlaid on a grid. Vibrant arrows intersect throughout, depicting movement and shifts in analytical and financial trends. This futuristic design suits uses such as digital marketing for tech-based financial platforms, educational tools for online courses on data analysis, or visual backgrounds for presentations related to financial strategy or economic forecasts.

downloads
Tags:
More
Credit Photo
If you would like to credit the Photo, here are some ways you can do so
Text Link
photo Link
<span class="text-link">
<span>
<a target="_blank" href=https://pikwizard.com/photo/dynamic-data-flow-with-analytics-visuals-on-grid/3283dd4b3b73847ceebec8440bbb044f/>PikWizard</a>
</span>
</span>
<span class="image-link">
<span
style="margin: 0 0 20px 0; display: inline-block; vertical-align: middle; width: 100%;"
>
<a
target="_blank"
href="https://pikwizard.com/photo/dynamic-data-flow-with-analytics-visuals-on-grid/3283dd4b3b73847ceebec8440bbb044f/"
style="text-decoration: none; font-size: 10px; margin: 0;"
>
<img src="https://pikwizard.com/pw/medium/3283dd4b3b73847ceebec8440bbb044f.jpg" style="margin: 0; width: 100%;" alt="" />
<p style="font-size: 12px; margin: 0;">PikWizard</p>
</a>
</span>
</span>
Free (free of charge)
Free for personal and commercial use.
Author: Awesome Content