1. Home > 
  2. Stock Photos > 
  3. Dynamic Data Visualization with Binary Matrix

Dynamic Data Visualization with Binary Matrix Image

Dynamic Data Visualization with Binary Matrix

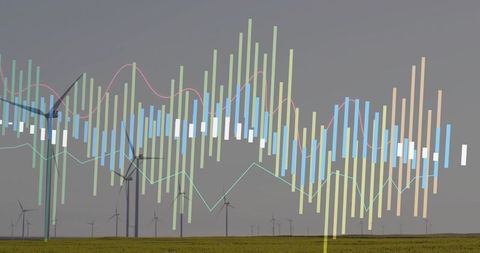
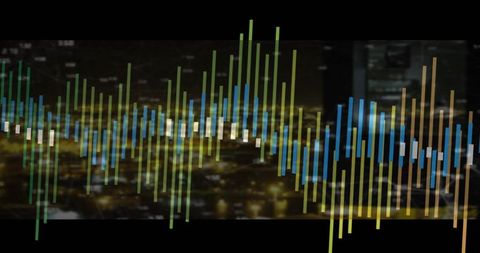
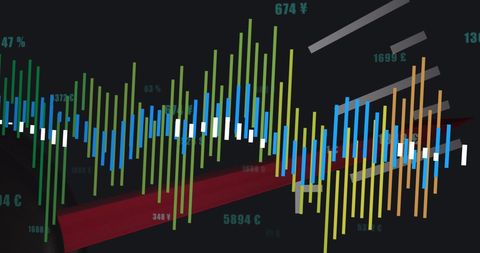
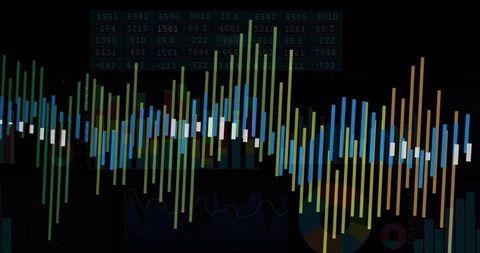
This abstract representation showcases colorful vertical bars juxtaposed against a background of floating binary numbers, capturing the essence of data visualization and digital interfaces. The vibrant hues imply varying intensities and data fluctuations, creating a sense of dynamic movement and information flow. Perfect for illustrating concepts in data analytics, information technology, signal processing, and modern digital solutions. Ideal for use in presentations, websites, and articles focusing on tech innovation and futuristic design.

Powered by Shutterstock logo - Get 15% off with code: PIKWIZARD15
Displaying central vertical bar chart on dark dashboard, with data table and binary overlay. Analytics, visualization, data, digital, technology, dashboard, intelligence - Powered by Shutterstock - Get 15% off with code: PIKWIZARD15Showing interface over misty skyline with bar line pie charts percentages TESTING PR2 binary digits. Futuristic, data visualization, digital interface, analytics, urban, technology, abstract - Powered by Shutterstock - Get 15% off with code: PIKWIZARD15Business analysis image, colorful graphs and charts - Powered by Shutterstock - Get 15% off with code: PIKWIZARD15Creative collage artwork showcasing modern graphic design trends with a colorful bar chart and a sitting person illustration - Powered by Shutterstock - Get 15% off with code: PIKWIZARD15Miniature people: Businessman looking at
 analyst bar graph and colorful wood number 2018 with copy space using as background money, financial, business concept. - Powered by Shutterstock - Get 15% off with code: PIKWIZARD15

Credit Photo

If you would like to credit the Photo, here are some ways you can do so

Free (free of charge)

Free for personal and commercial use.

Author: Creative Art

Similar Free Stock Images

Futuristic multicolor vertical waveform bars with faint scientific equations and molecules
Premium
Horizontal macro shot of a luminous data matrix with multicolor dots and code fragments, illustrating data analysis, computing processes and cyber technology.
Colorful Digital Data Processing Network Connections
Premium
Data analyzing in emerging market trading: the charts and summary info for making emerging market trading. Charts of financial instruments in emerging market to do technical analysis.
Premium
office desk - colorful graph with laptop screen infographic
Colorful Data Streams in Digital Interface
Digital Global Dashboard with Bar Chart and Data Visualization
Dynamic Financial Market Chart Display with Candlesticks
Colorful Digital Waveform Chart Analytics
Boat Drifting at Sunset with Digital Bars Overlay
Cityscape with Data Visualization Overlay Exhibiting Urban Analytics
Abstract Data Processing Visualization on Blue Gradient
Real-Time Financial Market Trends Visualization with Candlestick and Histogram
Digital World Statistics and Analytics
Cybersecurity with Candlestick Chart and Digital Interface
Dynamic Bar and Line Chart on Modern Analytics Dashboard
Dynamic Financial Data Analysis With Abstract Global Background
Encrypted waveform visualizing secure network traffic on futuristic digital dashboard UI
Digital Stock Chart with Abstract Network in Pink Hues
Abstract Financial Data Visualization on Tech Background
Digital Data Charts with Virtual Graphs on Black Background
Premium
Modern startup business office, Businessman analyzing financial market with blank post it, finance and marketing concept.
Premium
Business charts and data are magnified by a lens symbolizing detailed analysis and strategic planning for financial growth.
Multicolored Data Visualization on Wooden Desk for Insightful Analysis
Colorful Graphical Data Analysis in Abstract Background
Futuristic Trading Dashboard with Neon Graphs and Data Visualization
Pulsating neon audio waveform over dusk highway light trails for music and tech visuals
Binary Code with Colorful Bar Graph for Data Analysis
Dynamic Financial Data Chart on Dark Digital Dashboard
Dynamic Financial Data Analysis with Interactive Charts and Graphs
Digital Data Chart Visualization in Modern Office Environment
Colorful Financial Data Bars Over Cityscape at Dusk
Neon Financial Data Visualization with Multicolored Candlestick Bars and Trend Lines
Ukrainian Flag with Financial Graphs Depicting Economic Crisis
Colorful Abstract Lines Overlapping Vibrant City Lights at Night
Dynamic Data Visualization on Digital Interface
Colorful Financial Graph with Digital Technology Concept
Premium
Multi-colored diagram on black background. Triangle of wooden pieces
Futuristic Digital Data Analysis Visual with Line Graphs
Premium
Information Info Data Analysis Storage Concept
Financial Data Visualization Analysis on Black Background
Digital Financial Data Analysis with Vibrant Graphs
Abstract Digital Data Analysis with Bar Chart on Dark Background
Abstract Digital Data Visualization
Digital Analytics Dashboard with Code and Graphs Visualization
Premium
Miniature people standing on the bar graph.
Dynamic Graphs over Empty Office Symbolize Business Progress
AI
Abstract Glowing Green Data Waves with Digital Interference
Digital Data Analysis with Rising Arrows on Black Background
Futuristic Data Analysis with Cityscape Background
Premium
Adult female hand points with a pen at a screen with infographics in the form of columns. Comparison of financial results in management
Financial Growth Concept with Cityscape Overlay Design
Digital Graph with Abstract Data on Blue Background
Pulsing Digital Data Analytics with Futuristic Circuit Design
Financial Data Overlays in Modern Office Workspace
Premium
Forex Chart hologram on table with computer background. Multi exposure. Concept of financial markets.
Premium
Binary computer code - Matrix Blue Abstract background
Dynamic Digital Financial Data Visualization on Dark Background
Multi-Colored Charts Superimposed Over Urban Skyline
Digital Data Processing Over Modern Glass Building
Colorful Digital Waveform Display with Vertical Bars
Digital Data Streams Around Globe Representing Global Business
Futuristic Data Visualization with Global Map and Bar Graphs
Premium
Big Data Analytics Neural Network Data Flow Visualization, AI Machine Learning, Quantum Computing, Binary Code Digital Grid, Futuristic Artificial Intelligence Technology Abstract Background
Financial Candlestick Chart on Digital Grid Background
Abstract Digital Financial Chart on Blue Interface
Abstract Graphical Data Representation in Blue Tones
Dynamic Financial Data Analysis on Digital Platform
Premium
In warehouse, image of 3D bar chart displaying monthly data on shelves. analytics, statistics, business, logistics, inventory, commerce
Displaying multi-series bar chart with smooth trend lines and metric callouts on dark navy backgroun
Digital Waveform Visualization on Blurred Background
Digital Data Analysis Over World Map with Graphs and Codes
Premium
Business Data Graph Bar Chart Technology Devices Concept
Premium
business charts, 3D illustration
Premium
Displaying network graph animating in 3D dashboard with teal nodes, purple bars and numeric labels. Futuristic, technological, data, visualization, digital, abstract, high-tech
Dynamic Data Visualization with Bar Charts and Line Graphs in Digital Interface
Dynamic Financial Trading Display with Neon Grid Pattern
Digital Financial Graphs on Dark Background Highlighting Global Economy Trends
Colorful Soundwave Over Urban Skyline Abstraction
Premium
Virtual Bitcoin sketch on a modern coworking room background. Double exposure
Abstract Digital Data Flow on Modern Building Facade
Digital Financial Data Over Urban Night Skyline
Abstract Financial Data Analysis on Black Background
Colorful Sound Waves Over Night Cityscape with Neon Lights
Premium
Visualizing 3D bar chart on blue screen, with overlaid line plot, curved surface, numeric labels. Infographics, analytics, data, digital, technology, innovation, dashboard
Abstract Colorful Bar Graph on Red Background
Dynamic Financing Data Visualization on Hungary Flag
Digital Data Processing with Vibrant Graphs
Premium
Used in business
Premium
The company's expansion into international markets required careful market research and strategic planning.
Premium
Businessman holding graph growth and increase of chart positive indicators in his business.Investment up concept.analyzing sales data and economic,strategy and planning, Digital marketing and stock
Futuristic Energy Analytics Interface with Sustainability Icons
Dynamic Bars Overlapping Graph in Financial Analysis
Digital Stock Market Data with Upward Trend Graph
Wind Farm Data Viz with Colorful Bars and Line Charts for Renewable Energy Analytics
Dynamic HTML Code and Waveform Bar Interface for Cybersecurity
Colorful Financial Data Visualization with Statistical Graphs
Displaying Falling Candlestick Chart on Dark Data Dashboard with Teal Axis and Metrics
Dynamic Digital Financial Analysis with 3D Graphics
Digital Data Visualization with Abstract Bar Graphs
Financial Data Overlay on Busy Construction Site
Colorful Financial Data Graph on Dark Interface
Premium
Graph inhand on white background
Colorful Bar Charts and Arrows on Vivid Red Background
Dynamic Colorful Wave Pattern on Dark Background
Colorful Data Visualization with Technological Icon Elements
Digital Data Visualization Over City Skyline at Night
Financial Data Visualization Overlaying Workspace
Premium
Creative business concept image collage of analysis crypto industry shareholders income stats isolated on green color background
Premium
Image of financial data processing over cityscape. Global business, finances, computing and data processing concept digitally generated image.
Abstract Financial Charts with Colorful Holographic Effects
Digital Financial Data Visualization with Bar Graphs and Line Charts
Digital Data Visualization in Abstract Design
Abstract Data Visualization with Growing Charts
Financial Market Analysis Display with Candlestick Chart
Abstract Data Graph Infographic on Purple Gradient Background
Urban Finance Data Visualization with Candlestick Chart Overlay
Dynamic Trading Graph with Binary Coding Overlay
Colorful Bar Graph Rising Against Gradient Sky
3D Digital Visualization of Candlestick Chart with Abstract Wave Pattern
Digital Financial Data and Market Trends Analysis on Black Background
Digital Financial Graph and City Silhouette Backdrop
Dynamic NFT Display with Digital Trading Finance Analytics
Premium
Displaying dashboard showing cyan orange bars on screen, with white red graphs and light-blue wave. Data, analytics, visualization, infographics, finance, technology, digital
Explore More Free Stock Images