1. Home > 
  2. Stock Photos > 
  3. Dynamic Data Visualization with Businesspeople Walk

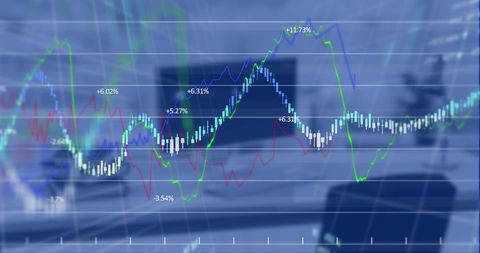
Dynamic Data Visualization with Businesspeople Walk Image

Dynamic Data Visualization with Businesspeople Walk

This visual representation integrates data charts and businesspeople in motion, symbolizing dynamic market activity and the global business environment. It serves well in contexts such as finance reports, technology-focused business articles, or corporate strategy materials, depicting themes of economic trends, digital data interaction, and strategic movement in business.

Powered by Adobe logo
Stock exchange, overlay or business people with computer for data analysis, late market research or teamwork. Investment growth, pc or brokers talk for trade choice, revenue charts or graphs at night - Powered by AdobeA professional businesswoman uses a magnifying glass to analyze stock market data on a laptop, surrounded by financial charts in a modern office setting. Scalp - Powered by AdobeTwo business people shaking hands with glowing digital connections and financial data overlay - Powered by Adobesmiling asian businesswoman in yellow top looking at camera during a collaborative team meeting analyzing charts and financial data with a male colleague in a bright office - Powered by AdobeBusinesswoman using stylus pen pointing on digital tablet screen while working and analyzing financial charts and graphs showing changes on the market - Powered by Adobe

Credit Photo

If you would like to credit the Photo, here are some ways you can do so

Free (free of charge)

Free for personal and commercial use.

Author: Awesome Content

Similar Free Stock Images

Stock Market Trends Visual with Growth Charts on Black Background
Premium
Smiling business woman uses tablet analyzing stock market data at night. Financial growth graphs, data trends overlaid on screen. Successful trader investor monitors investment performance on digital
Dynamic Financial Market Graph Amidst Digital Equations
Financial Data Analysis with Growth Trend Arrows on Digital Interface
Financial Data Analysis Digital Interface Over Cityscape
Financial Data and Shipment Operations in Warehouse Overlay
Premium
young indian business man trader wearing glasses looking at computer screen with trading charts reflecting in eyeglasses watching stock trading market financial data growth concept close up no logos
Financial Data Charts in Shimmering Blue Digital Space
Digital Financial Data Trends and Analytics Conceptual Background
Financial Data Analysis with Global Market Interface
Financial Graph Overlaying Retail Store Backdrop Visualizing Market Trends
Premium
Cropped image of businesswoman analyzing chart on mobile phone
Data Security with Tech Bar Graph Overlay
Digital Line Graph Overlay on Modern Office Space
Financial Data Overlay on Urban Skyscrapers
Dynamic Business Analysis with Global Digital Interface Figures
Premium
Pie chart analysis. Analysis of market share or sales composition. Businessperson tapping charts on analytics dashboard.
Abstract Financial Market Data with CGI and Code Overlay
Dynamic Analysis of Stock Market Trends and Patterns
Dynamic Statistical Data Analysis on Digital Grid Network
Dynamic Financial Growth Chart with Office Background
Premium
Stock exchange, talk or business people with computer for data analysis, late market research or teamwork. Investment growth, pc or brokers with overlay for trade choice, charts or graphs at night
Futuristic Data Analysis Overlaying Cityscape Digital Interface
Analyzing Financial Data with Business Charts Against Urban Skyline
Dynamic Stock Market Data Analysis With Graphs and Percentages
Fluctuating Stock Market Data on Cityscape Background
Premium
Focused female stock trader examining data on multiple screens, concept for financial analysis, investment strategies and market monitoring
Diverse Team Collaborating with Data Interfaces in Modern Office
Business Professionals Analyzing Stock Market Data on Laptop
Digital Financial Data Analysis on Grid Framework
Trend Analysis with Candlestick Chart and Data Indicators
Dynamic Stock Market Trends with Graphs on Digital Display
Dynamic Stock Market Graphs with Finance Data
Premium
Businessman and business woman reviewing financial documents, collaborating over laptop screen, analyzing market charts for strategic corporate planning. Businesspeople and finance concept
Financial Data Streaming with Arrows Over Graphic Indicators
Dynamic Financial Graphs Over Cityscape Background
Financial Chart and Rotating Globe on Digital Grid Background
Dynamic Green Stock Chart on Digital Grid Background
Premium
Back view of a woman analyzing a holographic stock market graph, glowing data visualizations, and futuristic interface representing finance, technology, and analytics.
Abstract Financial Data Analysis and Global Business Concept
Financial Data Analysis with Stock Market Trends
Financial Data Analysis in Modern Server Room Environment
Diverse Team Analyzing Business Market Trends with Technology
Premium
Pro analyst monitoring stock market charts on multiple screens. Man observes financial data trends in trading room. Businessperson analyzes market performance. Investor examines stock price
Financial Analysis Dashboard Overlay on Modern Office Workspace
Financial Data Visualization Overlaying Modern Office Setting
Overlay of Financial Data on Business People in Office Building
Dynamic Digital Market Analysis with Holographic Data
Premium
Woman in business attire working at a desk with three monitors displaying stock market charts and financial data, illustrating trading and investment
Cybernetic Data Flow with Digital Network Connections
Businesswomen Analyzing Financial Graphs for Growth Opportunities
Financial Analysts Discussing Data Charts in Corporate Office
Digital Financial Data Analytics Overlay in Modern Office
Premium
A businessman is engaged in stock market analysis using a smartphone, showcasing graphs and charts that highlight trends and data in a modern office environment. Scalp
Abstract Economy Concept with Graph and Urban Scenes
Asian Man Analyzing Financial Data Graphs in Server Room
Data Visualization on Digital Interface with Graphs and Codes
Financial Data and Stock Market Trends Overlaying Cityscape
Premium
Man in suit uses tablet checking stock market charts on large digital display. Financial analyst studies trading data, market trends, graphs on screen. Modern office technology for investment,
Businessman Analyzing Data with Graphs Overlaid
Financial Data Analysis with Growing Stock Trends
Neon Candlestick Chart on Grid with Data Analytics Theme
Dynamic Stock Market Graphs Indicating Financial Trends
Financial Data Processing in Modern Office Environment
Rising Stock Market Trend with Digital Data Analytics
Premium
Close-up of businesswoman eyes, wearing glasses with blue tint, focusing on financial charts. Woman face is framed by gray background, emphasizing her eyes and glasses. Financial data analysis.
Dynamic Financial Data Overlaying Urban Cityscape
Financial Data Flow against Urban Skyline Backdrop
Digital Data Analytics Overlay on Cityscape
Dynamic Stock Market Graphs and Financial Data Visualization
Premium
Young businesswoman monitors stock market graphs on multiple computer screens. Female trader working at office looking at financial charts. Investor working in trading room. Finance and economy.
Abstract Data and Technology with Business Facilitator
Digital Finance Chart Displayed in Modern Office
Business Colleagues Collaborating with Financial Graphs Overlay
Digital Data Trends Over High-Tech Server Room
Premium
Silhouette of a person contemplating financial market charts against a backdrop of bubbles
Dynamic Stock Market Chart Displaying Fluctuating Trends and Growth Percentages
Dynamic Financial Data Chart Display with Graphical Analysis
Abstract Financial Graphs with Rising Trends and Positive Indicators
Digital Finance Data Overload with Code and Graphs
Premium
Businesswoman stressed at work while analyzing financial data with charts and graphs displayed on computer screens
Financial Graphs with Social Media Analytics on Digital Chart
Dynamic Data Processing Concept in Digital Interface Design
Stock Market Graph and Data Analysis
Dynamic Financial Graphs and Data Analysis Interface
Premium
Businessperson uses smartphone to check rising financial graphs and charts showing positive growth and success in the stock market
Advanced Data Processing with Graphs and Futuristic Network Overlay
Engineers Analyzing Financial Data in Server Room
Dynamic Financial Data Projection in Modern Office Environment
Financial Data Visualization with Increasing Graph Trend
Premium
Business people with stock market chart financial trading, online investment, stock exchange analysis, market trends, real-time trading data, forex and crypto trading economic forecasting tool
Digital Financial Data Visualization on Dark Screen
Candlestick Chart Displaying Market Trends with Analytical Lines
Dynamic Digital Stock Market Ticker with Growing Graph Trends
Financial Data Displayed Over City Skyline with Rising Graphs
Abstract Financial Stock Market Data in Modern Office
Digital Financial Data with Trending Arrows
Premium
young indian business man trader wearing glasses looking at computer screen with trading charts reflecting in eyeglasses watching stock trading market financial data growth concept close up no logos
Dynamic Stock Market and Financial Data Analysis Concept
Financial Graphs with Cityscape Background Reflecting Market Trends
Analyzing Financial Data in a Business Technology Office
Financial Trends Overlaid on Office Desks with Data Points
Premium
Financial market data displayed as a digital chart with multiple graphs and candlestick patterns, representing stock trends and economic analysis
Entrepreneur Analyzing Stock Market Data with Tablet Device
Data Processing Visualization with Code and Graphs
Digital Financial Data Analysis with Graphs and Stock Market Trends
Analyzing Financial Market Trends with Data Visualization
Premium
Focused stock trader analyzing market data on multiple computer screens
Financial Analysis Team Collaborating on Market Trends
Executives Analyzing Stock Market Trends in a Business Setting
Dynamic Forex Trading Graphs with Increasing Numbers
Digital Finance Network with User Profiles and Graphs
Premium
Indian Businesswoman Presenting Data Analytics in a Modern Office Meeting
Graphical Stock Data Overlapped on Urban Architecture
Global Financial Technology Network and Data Analytics
Global Financial Data Visualization with Digital Overlays
Soundwave Visualization and Data Analysis on Digital Grid
Premium
Hands typing on keyboard with stock market graphs on monitors in background
Dynamic Financial Data with Overlaid Cityscape Interface
Colleagues Analyzing Data with Digital Graph Overlay
Financial Graphs and Digital Data on Dark Background
Glowing Stock Market Financial Chart Data Overlay
Premium
Man in suit analyzes charts and graphs with pen. Businessman reviews financial data and reports. Person works in office, examining stock market trends and investment performance.
Pulsing Circular HUD Overlaying Neon Binary Data Dashboard for Fintech Analytics Visuals