
- Home >
- Stock Photos >
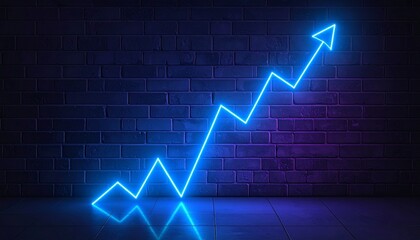
- Dynamic Data Visualization with Fluctuating Trendline and Indicators
Dynamic Data Visualization with Fluctuating Trendline and Indicators Image

Fluctuating trend line graph shows dynamic changes in a business dashboard. Includes speech-bubbles, warning-triangle, and pin markers indicating key data points, measurements, or alerts. Developed for presentations, data analysis seminars, financial reviews, technical guides, and business performance monitoring.
Powered by 


downloads
Tags:
More
Credit Photo
If you would like to credit the Photo, here are some ways you can do so
Text Link
photo Link
<span class="text-link">
<span>
<a target="_blank" href=https://pikwizard.com/photo/dynamic-data-visualization-with-fluctuating-trendline-and-indicators/ee66202258b9a9e63268eb6f731999a7/>PikWizard</a>
</span>
</span>
<span class="image-link">
<span
style="margin: 0 0 20px 0; display: inline-block; vertical-align: middle; width: 100%;"
>
<a
target="_blank"
href="https://pikwizard.com/photo/dynamic-data-visualization-with-fluctuating-trendline-and-indicators/ee66202258b9a9e63268eb6f731999a7/"
style="text-decoration: none; font-size: 10px; margin: 0;"
>
<img src="https://pikwizard.com/pw/medium/ee66202258b9a9e63268eb6f731999a7.jpg" style="margin: 0; width: 100%;" alt="" />
<p style="font-size: 12px; margin: 0;">PikWizard</p>
</a>
</span>
</span>
Free (free of charge)
Free for personal and commercial use.
Author: Authentic Images
Similar Free Stock Images

Premium


Premium


Premium


Premium


Premium


Premium
Premium


Premium

Premium


Premium


Premium


Premium


Premium


Premium


Premium


Premium


Premium


Premium


Premium


Premium


Premium


Premium


Premium


Premium


Premium


Explore More Free Stock Images