- Home >
- Stock Photos >
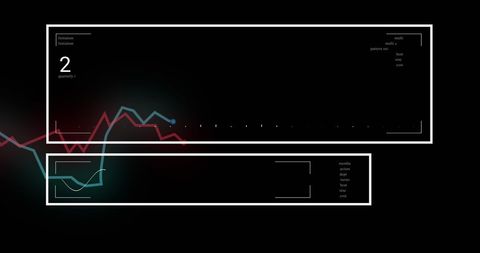
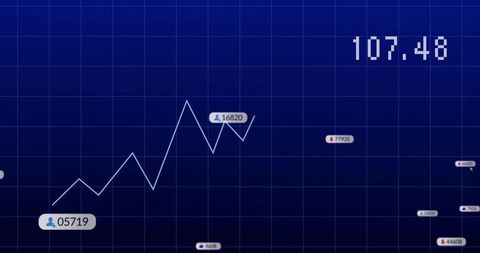
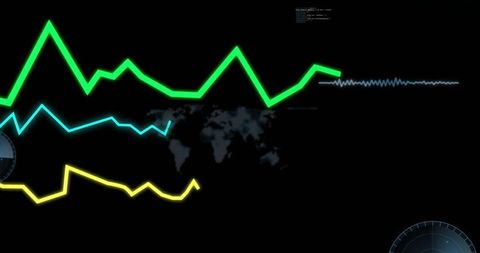
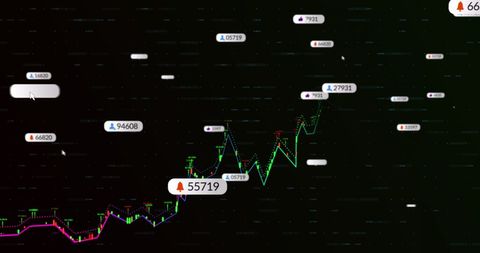
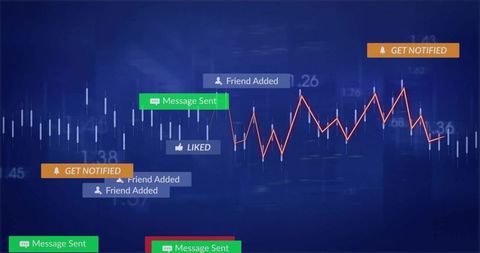
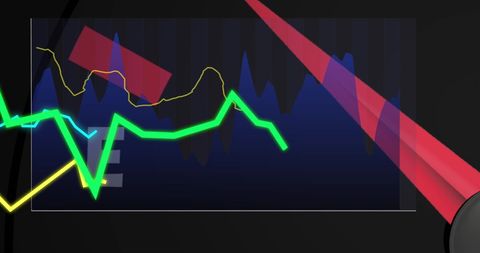
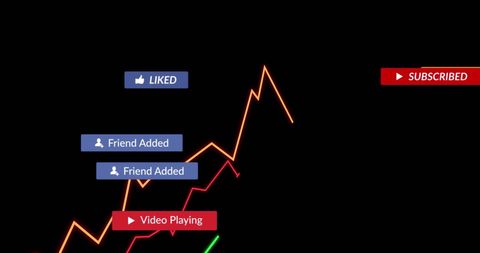
- Dynamic Digital Dashboard with Analytics and Heart Count Interaction
Dynamic Digital Dashboard with Analytics and Heart Count Interaction Image

Abstract depiction of digital dashboard visualizing interactive trends and analytics with artistic flare. Features red and blue oscillating line graphs paired with heart counters reflecting data interaction. Ideal for technology presentations, software showcases, analytics case studies, and discussions on data-driven decision-making processes. Conveys concepts of monitoring and modern data management.

downloads
Tags:
More
Credit Photo
If you would like to credit the Photo, here are some ways you can do so
Text Link
photo Link
<span class="text-link">
<span>
<a target="_blank" href=https://pikwizard.com/photo/dynamic-digital-dashboard-with-analytics-and-heart-count-interaction/30845af29c8780b6d871fc814fe79fcc/>PikWizard</a>
</span>
</span>
<span class="image-link">
<span
style="margin: 0 0 20px 0; display: inline-block; vertical-align: middle; width: 100%;"
>
<a
target="_blank"
href="https://pikwizard.com/photo/dynamic-digital-dashboard-with-analytics-and-heart-count-interaction/30845af29c8780b6d871fc814fe79fcc/"
style="text-decoration: none; font-size: 10px; margin: 0;"
>
<img src="https://pikwizard.com/pw/medium/30845af29c8780b6d871fc814fe79fcc.jpg" style="margin: 0; width: 100%;" alt="" />
<p style="font-size: 12px; margin: 0;">PikWizard</p>
</a>
</span>
</span>
Free (free of charge)
Free for personal and commercial use.
Author: Creative Art