1. Home > 
  2. Stock Photos > 
  3. Dynamic Digital Graph Showing Global Data Movement

Dynamic Digital Graph Showing Global Data Movement Image

Dynamic Digital Graph Showing Global Data Movement

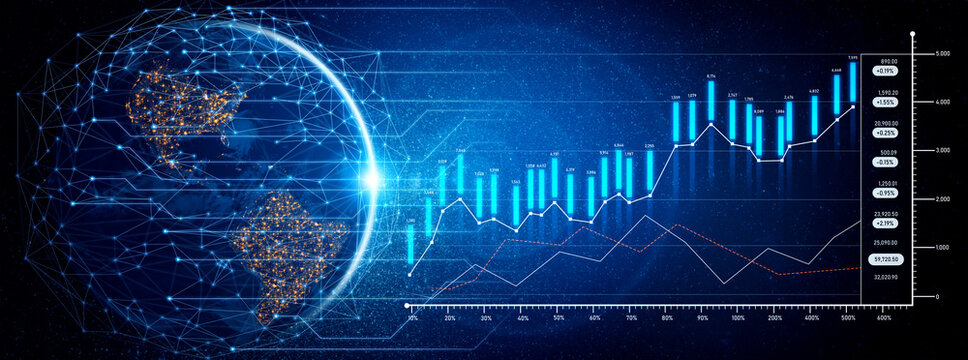
This graph embodies the concept of global data flow and analytics, highlighting trends and statistical analysis through digital visualization. Useful for illustrating themes related to the global digital economy, financial analytics, and data science. Suitable for use in presentations on technology, finance, or internet of things (IoT) to emphasize the power of data-driven decision-making.

Powered by Adobe logo
High-tech global data visualization featuring a digital map and a vibrant line graph. Ideal for illustrating economic growth, technology, and analytics concepts in presentations. Scalp - Powered by AdobeGlobal Network Connections and Digital Earth Visualization. - Powered by AdobeGlowing Earth surrounded by radiant bars, cosmic data visualization in futuristic digital space. - Powered by AdobeAbstract image depicting financial data overlaid on a blurred cityscape background, suggesting the dynamism of urban markets and global finance - Powered by Adobe3D data visualization graph, lines, dots on a digital tablet, with vibrant blue color highlighting statistical data against the blurred background. - Powered by Adobe

Credit Photo

If you would like to credit the Photo, here are some ways you can do so

Free (free of charge)

Free for personal and commercial use.

Author: Authentic Images

Similar Free Stock Images

Social Media Activity Icons on Digital Graph
Premium
Abstract network structure with glowing nodes.  Metallic spheres interconnected, showing complex relations
Financial Data Charts with World Map on Blue Digital Background
Premium
Abstract digital landscape with glowing orange bars on a wavy blue and orange particle surface. Futuristic data visualization, network connections, or financial graph simulation in cyberspace.
Premium
A hand interacts with a digital display showcasing data visualizations, charts and graphs, illuminated with bright hues, against a dark, blurred backdrop
Financial Data Analysis Vibrant Graphs on Blue Background
Digital Stock Market Trends and Financial Growth Analysis
Digital Financial Data Graph Showcasing Market Trends
Data Analytics Graphs on Digital Interface Background
Rising Financial Data Graph on Digital Grid Background
Abstract Financial Data Chart with Positive Trends and Percentages
Financial Growth Chart with Data Visualization Elements
Bitcoin Symbol with Financial Data Dynamic Representation
Digital Financial Data and Global Business Analytics
Digital Financial Data and AI Illustration Networking Globally
Rising Graphs and Interactive Financial Data Analytics Background
Dynamic Financial Graph with Rising Trend on Blue Background
Premium
Modern network connections and data exchange visualization
City Skyline with Overlay of Financial Market Trends
Premium
Global business partnerships and international trade concept. A dashboard for worldwide market analytics, data visualization, and company strategy. Motif
Financial Data Visualization Over Futuristic Cityscape
Dynamic Data Visualization with Financial Charts and 3D Elements
Rising Digital Graph and Data Visualizations on Black Background
European Market Data Overlay with EU Flag and Financial Graphs
Financial Graphs Overlaying Industrial Junkyard
Digital Finance Network with User Profiles and Graphs
Abstract Digital Graphs Showing Financial Data Analysis
Glowing Financial Data Chart on Digital Grid Background
Premium
Futuristic digital network illustration showcases data flow with orange nodes and blue connections
Financial Chart and Rotating Globe on Digital Grid Background
Financial Data Statistics Visualized in Urban Setting
Dynamic Business Data and Cityscape Visualization
Financial Growth Statistic Data Processing Over Urban Cityscape
Financial Data Displayed Over City Skyline with Rising Graphs
Dynamic Stock Market Chart with Fluctuating Trends and Data Points
Digital Graphs Over Cityscape Representing Global Business Growth
Futuristic Digital Finance World Map with Dynamic Data
Premium
Global financial market growth analysis with an upward trending bar graph and interconnected digital earth network, depicting economic progress and data visualization for future trends.
Financial Graphs with Social Media Analytics on Digital Chart
Digital Data Processing with Chart in Futuristic Interface
Digital Interface with Virtual Data Surging Across Connection Globes
Abstract Financial Graphs on Dynamic Digital Interface
Dynamic Financial Data Graphs with Holographic Styles
Premium
Digital holographic screen displaying world map with data analytics and glowing light beam
Premium
Futuristic digital interface overlaying a cityscape, showcasing data visualization and global connections.
Blue Digital Data Wave with Graphical Interface Elements
Neon Red Market Trend Line with Social Media Engagement Callouts on Green Data Grid
Financial Data Graph Rendering Global Market Trends
Abstract Financial Market Data Analysis Visualization
Fluctuating Digital Stock Market Data Chart
Digital Data and Financial Charts on White Background
Dynamic Glowing Digital Graphs on 3D Grid Background
Dynamic Digital Data Analysis on Elevated Grid
Premium
Glowing Earth surrounded by radiant bars, cosmic data visualization in futuristic digital space.
Dynamic Financial Graphs Overlaying Urban Skyline
Dynamic Financial Charts and Graphs Indicating Market Trends
Abstract Digital Interface with Network Connections and Data Visualizations
Financial Data Flow against Urban Skyline Backdrop
Premium
Abstract representation of artificial intelligence network connections for the stock market
Abstract Financial Data and Numbers in Virtual Environment
Digital Finance Chart Showing Growth Trends with Analytics Data
Financial Data Analysis with Global Digital Interface
Dynamic Financial Growth Digital Chart Display
Complex Financial Data Visualization with Graphs
Premium
Abstract representation of artificial intelligence network connections for the stock market
Digital Data Visualization with Trend Lines and Percentage Changes
Dynamic Financial Data Analysis with Growth Indicators
Digital Finance: Modern Stock Market Analysis Display
Dynamic Financial Data and Stock Market Charts
Premium
Global Data Network Connections on World Map, Digital Communication and Business Logistics, Worldwide City Lights and Transport
Premium
Abstract network visualization with glowing connections and data representation on grid
Premium
Businessman interacting with digital global network and data visualization on tablet
Neon Analytics Dashboard Showing Rising Blue Trend Line, Red Volatility, Dotted Bars
Interactive Data Visualization with Emerging Analytics Trends
Futuristic Financial Data Analysis with Rising White Line Graph
Data Recovery Progress Display on Digital Interface
Premium
Business intelligence analytics dashboard with human icon, data visualization and global connections
Data Analytics and Financial Growth Indicators
Optimized Statistical Data Overlain on Corporate Architecture
Holographic Financial Graph with Dynamic Line Chart
Premium
Image of white cube arrangement with connected neon-green spherical nodes, representing connection, network, or data visualization concept
Abstract Digital Charts with Social Media Metrics Rising
Rising Financial Metrics on Digital Dashboard
Dynamic Financial Data Display in Digital Space
Digital Visualization of Global Networking with Statistical Graphs
Premium
Engineer using augmented reality interface to analyze construction data. Smart industry technology concept with futuristic digital graphs for modern global business project management.
Premium
Globed digital data visualization of global trends
Financial Growth Graph and Data Analytics Representation
Abstract Digital Finance Chart Showing Fluctuating Graph Lines
Financial Data Charts in Shimmering Blue Digital Space
Dynamic Financial Data Overlaid on Grid Background
Premium
Abstract digital visualization representing financial data trends and global connections, featuring soft colors and flowing lines.
Graph Lines Portraying Financial Data Trends
Dynamic Financial Data Visualization on Digital Grid Background
Dynamic Financial Graphs with Glowing Lens Flares and Data Points
Digital Interface with Data Graphs and JavaScript Code
Dynamic Lines Show Rising Financial Statistics Over Time
Digital Financial Data with Graph and Grid Patterns
Digital Financial Dashboard with Graphs and Data Visualization
Digital Cityscape with Financial Data Overlay
Interactive Social Media Metrics Overlaid on Business Data Graph
Dynamic Financial Graphs Overlaying Modern Cityscape
Digital Financial Data Overlay on Urban Street Scene
Candlestick Chart Visualization with Indicators and Growth Highlight
Premium
Abstract digital world map with glowing data points and graphical user interface elements displayed
Cityscape with Digital Stock Market Graphs and Statistics
Digital Finance Data Overlaying Futuristic Cityscape
Social Media and Stock Data Integration with Digital Graphics
Abstract Financial Data Processing and Analysis Interface
Premium
Data analysis business technology graphs world map statistics professional digital display information
Financial Growth Chart Displaying Performance Trends
Global Financial Data Analysis Visualized with Futuristic Interface
Digital Financial Analysis on Futuristic Grid
Dynamic Data Dashboard with Multicolored Trendlines and Chart Bars
Premium
Global logistics and supply chain network visualization with digital world map and shipping containers
Financial Data with Molecular Background Concept
Abstract Data Visualization with Dynamic Charts and Graphs
Futuristic Keyboard Analytics Display with Digital Graphs and Numbers
Futuristic Graph with Digital Globe Symbolizing Global Technology Connections
Premium
Global business growth graph stock financial success market chart on digital investment strategy exchange finance data concept 3d background of technology economy
Abstract Visualization of Data Analytics Dashboard with Speech Bubbles
Trend Analysis with Candlestick Chart and Data Indicators
Financial Data Overlay on Urban Skyscrapers
Digital Stock Market Graph Red Trendline on Green Background
Premium
Holographic AI interface with glowing text and data visualizations in a modern office environment, representing artificial intelligence in business.
Explore More Free Stock Images