
- Home >
- Stock Photos >
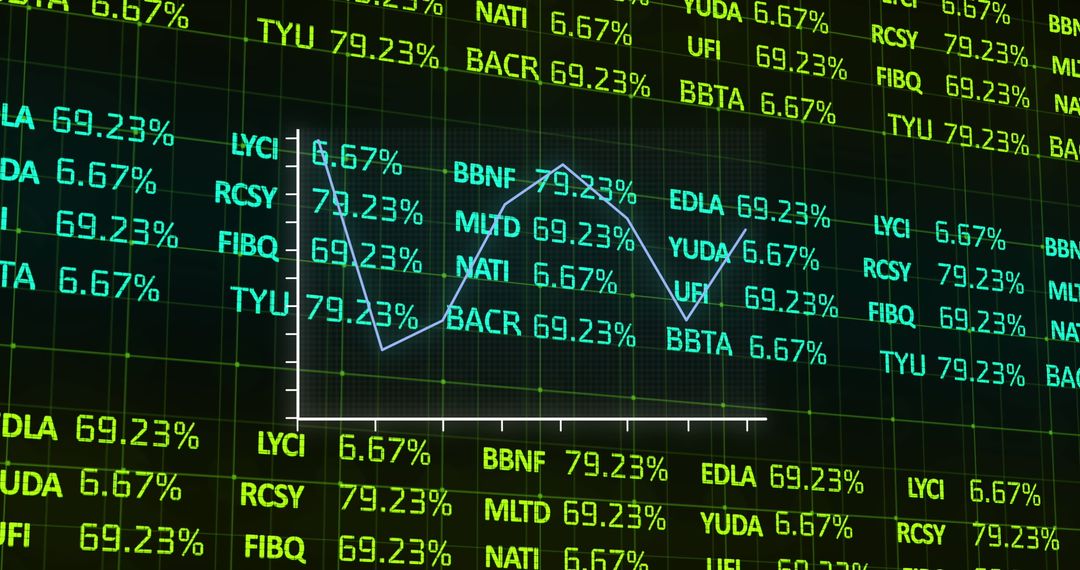
- Dynamic Financial Chart Illustrating Stock Market Volatility
Dynamic Financial Chart Illustrating Stock Market Volatility Image

Financial chart showing fluctuating trends over digital red backdrop symbolizes stock market volatility. Useful for presentations, articles, or teaching about finance, market trends, and economic shifts presenting data-driven insights.
Powered by 


2
downloads
downloads
Tags:
More
Credit Photo
If you would like to credit the Photo, here are some ways you can do so
Text Link
photo Link
<span class="text-link">
<span>
<a target="_blank" href=https://pikwizard.com/photo/dynamic-financial-chart-illustrating-stock-market-volatility/86769530575e57a30d9587ce2c2ab008/>PikWizard</a>
</span>
</span>
<span class="image-link">
<span
style="margin: 0 0 20px 0; display: inline-block; vertical-align: middle; width: 100%;"
>
<a
target="_blank"
href="https://pikwizard.com/photo/dynamic-financial-chart-illustrating-stock-market-volatility/86769530575e57a30d9587ce2c2ab008/"
style="text-decoration: none; font-size: 10px; margin: 0;"
>
<img src="https://pikwizard.com/pw/medium/86769530575e57a30d9587ce2c2ab008.jpg" style="margin: 0; width: 100%;" alt="" />
<p style="font-size: 12px; margin: 0;">PikWizard</p>
</a>
</span>
</span>
Free (free of charge)
Free for personal and commercial use.
Author: Creative Art
Similar Free Stock Images

Premium


Premium


Premium


Premium


Premium


Premium


Premium


Premium


Premium


Premium


Premium


Premium


Premium


Premium


Premium


Premium


Premium


Premium


Premium


Premium


Premium


Premium


Premium


Premium

