- Home >
- Stock Photos >
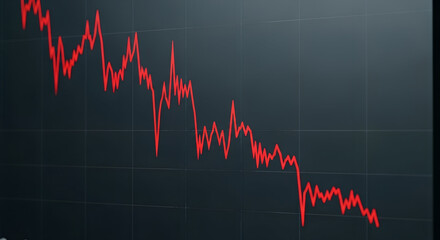
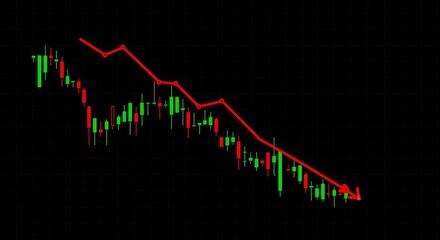
- Dynamic Financial Chart with Red Line Graph on Digital Interface
Dynamic Financial Chart with Red Line Graph on Digital Interface Image

Illustrates financial data and fluctuations on a digital interface, suitable for discussions on stock markets, economic forecasting, or investment analysis. Perfect for business presentations, financial blogs, or educational content on market dynamics.
Powered by 


downloads
Tags:
More
Credit Photo
If you would like to credit the Photo, here are some ways you can do so
Text Link
photo Link
<span class="text-link">
<span>
<a target="_blank" href=https://pikwizard.com/photo/dynamic-financial-chart-with-red-line-graph-on-digital-interface/60571f87819e3585c18a4ab984f94d57/>PikWizard</a>
</span>
</span>
<span class="image-link">
<span
style="margin: 0 0 20px 0; display: inline-block; vertical-align: middle; width: 100%;"
>
<a
target="_blank"
href="https://pikwizard.com/photo/dynamic-financial-chart-with-red-line-graph-on-digital-interface/60571f87819e3585c18a4ab984f94d57/"
style="text-decoration: none; font-size: 10px; margin: 0;"
>
<img src="https://pikwizard.com/pw/medium/60571f87819e3585c18a4ab984f94d57.jpg" style="margin: 0; width: 100%;" alt="" />
<p style="font-size: 12px; margin: 0;">PikWizard</p>
</a>
</span>
</span>
Free (free of charge)
Free for personal and commercial use.
Author: Awesome Content
Similar Free Stock Images
Loading...

Premium


Premium


Premium


Premium


Premium


Premium


Premium

Premium

Premium


Premium


Premium


Premium


Premium


Premium


Premium


Premium


Premium


Premium


Premium


Premium


Premium


Premium


Premium


Premium


Premium