- Home >
- Stock Photos >
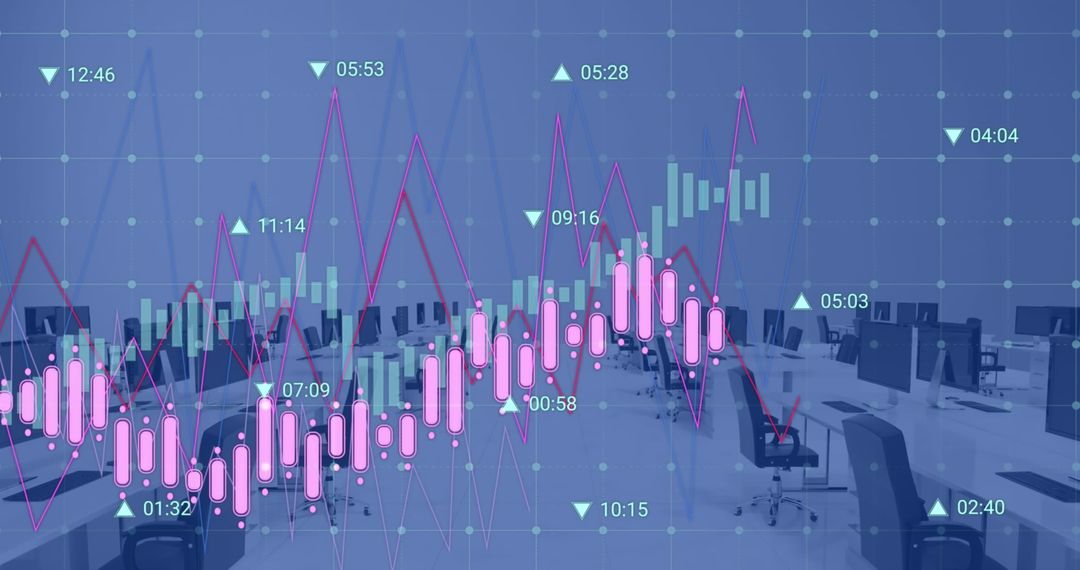
- Dynamic Financial Dashboard Displaying Bar and Line Charts
Dynamic Financial Dashboard Displaying Bar and Line Charts Image

Image shows dynamic interaction of diverse financial data through 3D grid graphical presentations. Strong selection for industries involving business intelligence, finance, and technology. Helpful resource in presentations, educational materials on digital analytics, market performance analysis.
Powered by 


2
downloads
downloads
Tags:
More
Credit Photo
If you would like to credit the Photo, here are some ways you can do so
Text Link
photo Link
<span class="text-link">
<span>
<a target="_blank" href=https://pikwizard.com/photo/dynamic-financial-dashboard-displaying-bar-and-line-charts/5254dd8eae98feb866feddeef174eeec/>PikWizard</a>
</span>
</span>
<span class="image-link">
<span
style="margin: 0 0 20px 0; display: inline-block; vertical-align: middle; width: 100%;"
>
<a
target="_blank"
href="https://pikwizard.com/photo/dynamic-financial-dashboard-displaying-bar-and-line-charts/5254dd8eae98feb866feddeef174eeec/"
style="text-decoration: none; font-size: 10px; margin: 0;"
>
<img src="https://pikwizard.com/pw/medium/5254dd8eae98feb866feddeef174eeec.jpg" style="margin: 0; width: 100%;" alt="" />
<p style="font-size: 12px; margin: 0;">PikWizard</p>
</a>
</span>
</span>
Free (free of charge)
Free for personal and commercial use.
Author: Awesome Content
Similar Free Stock Images

Premium


Premium


Premium


Premium


Premium


Premium


Premium


Premium


Premium


Premium


Premium


Premium


Premium


Premium


Premium


Premium


Premium


Premium


Premium


Premium


Premium


Premium


Premium


Premium