
- Home >
- Stock Photos >
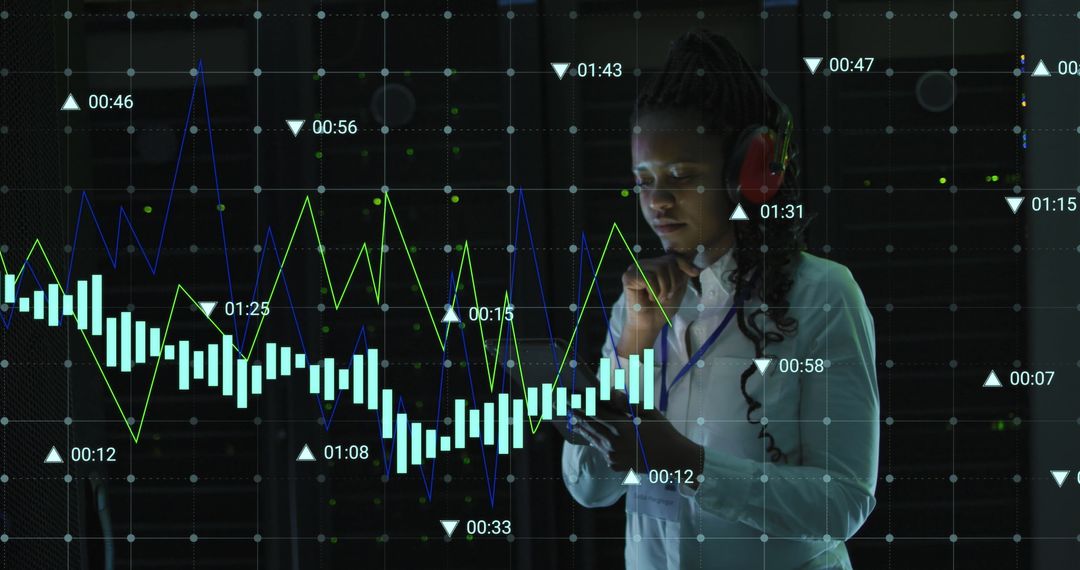
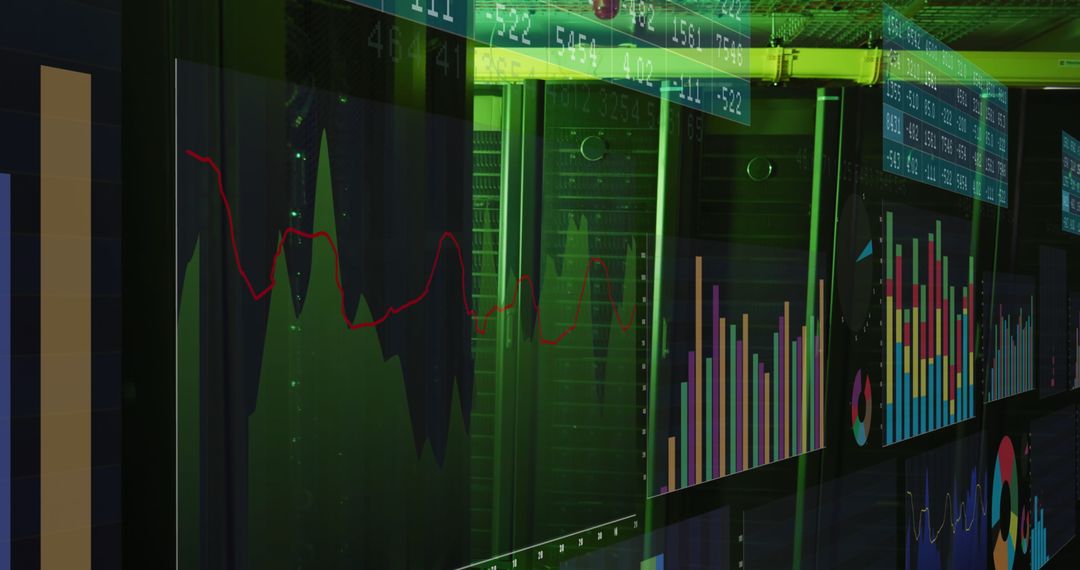
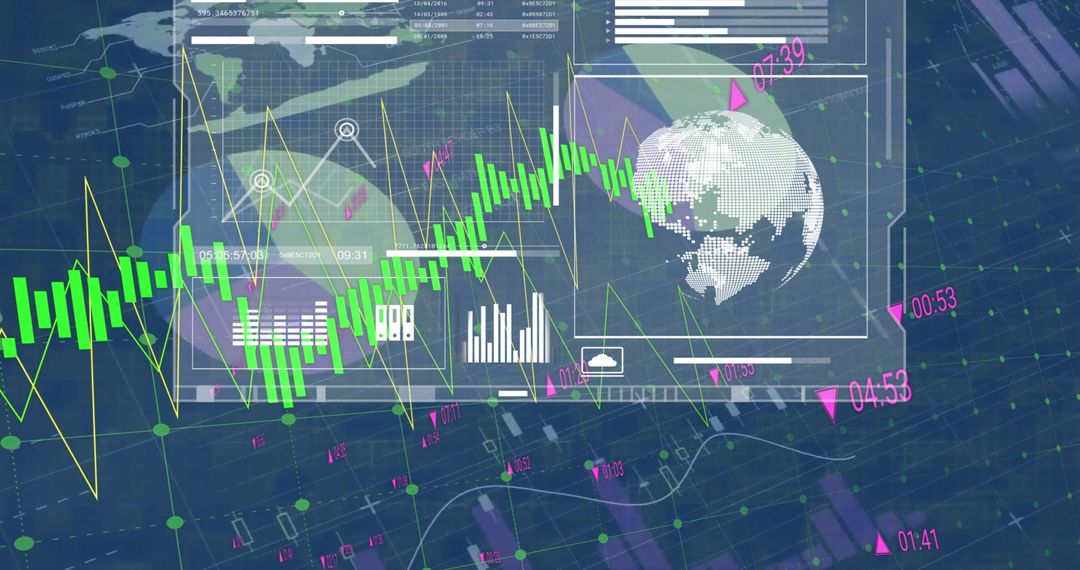
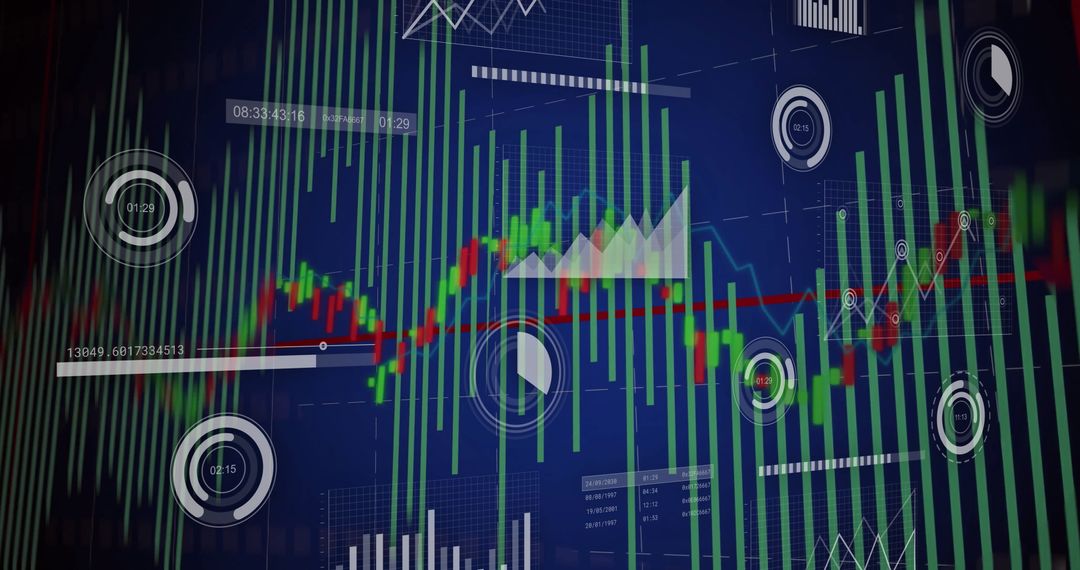
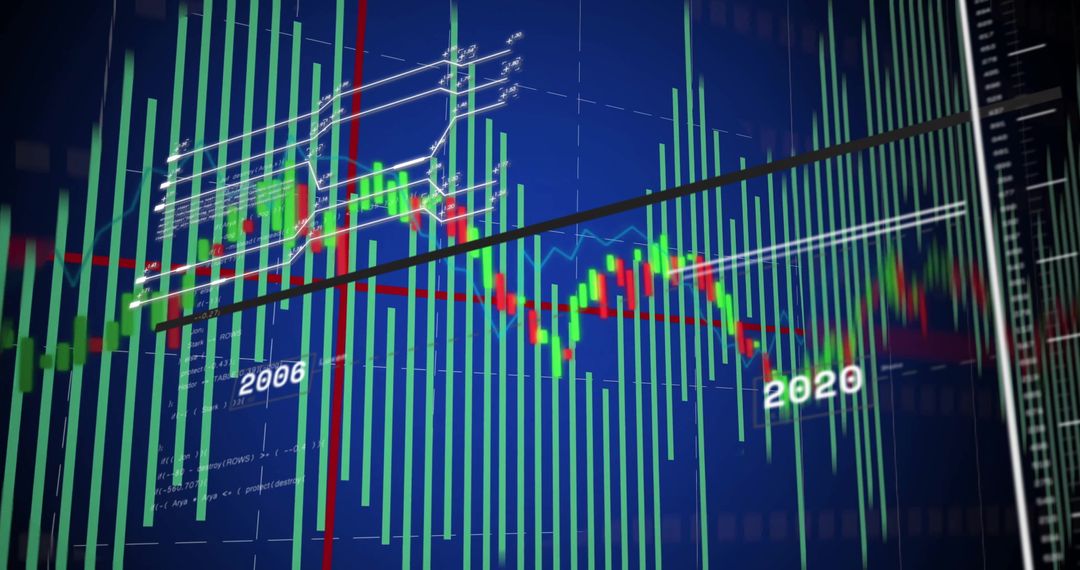
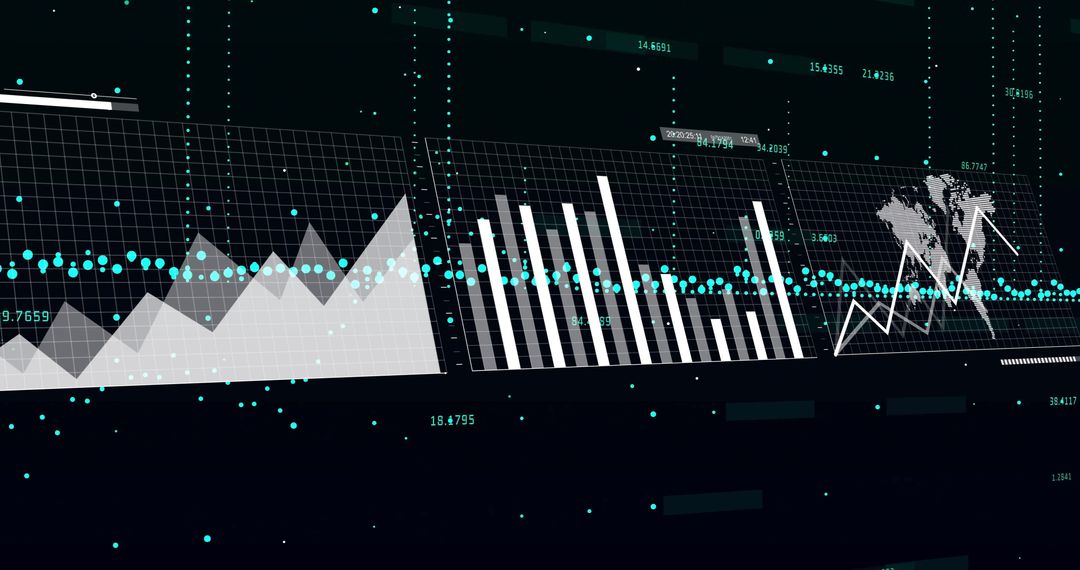
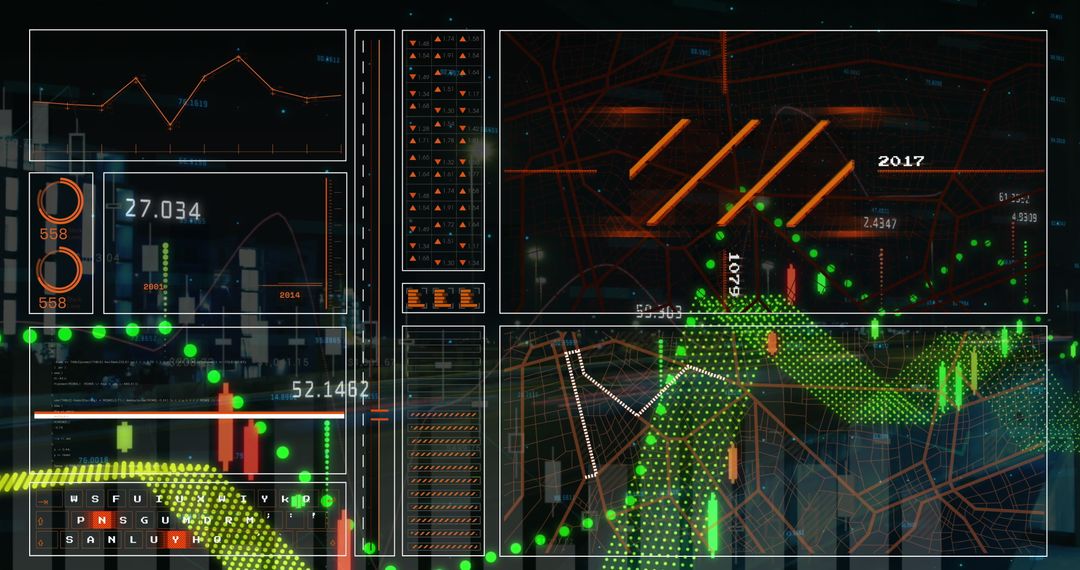
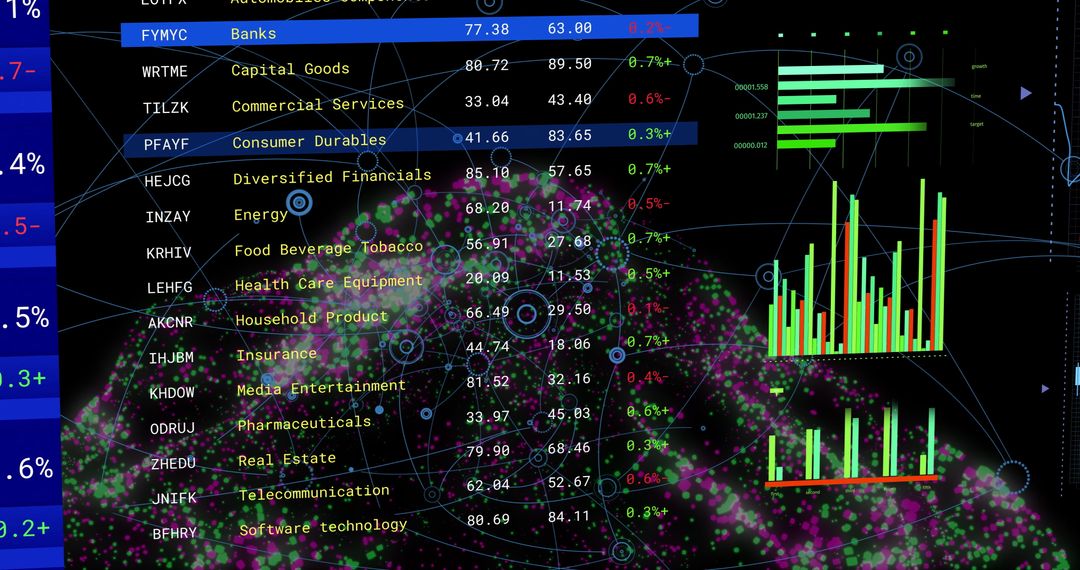
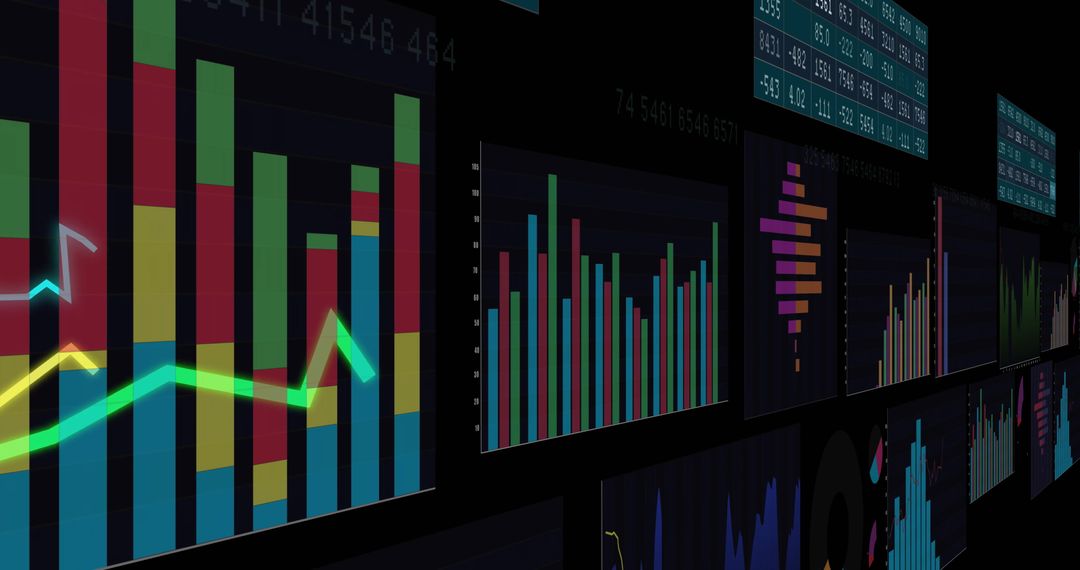
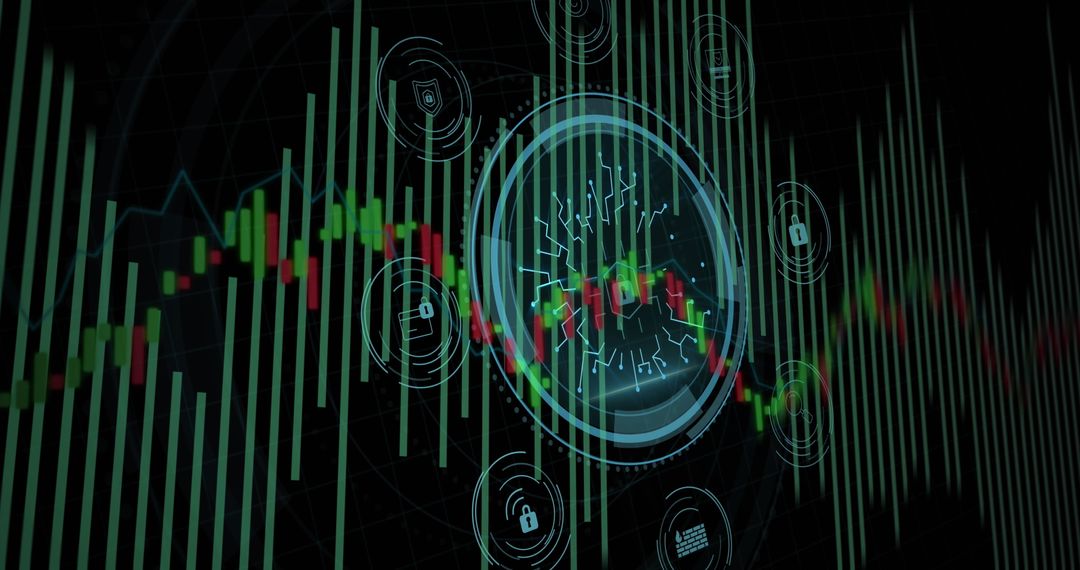
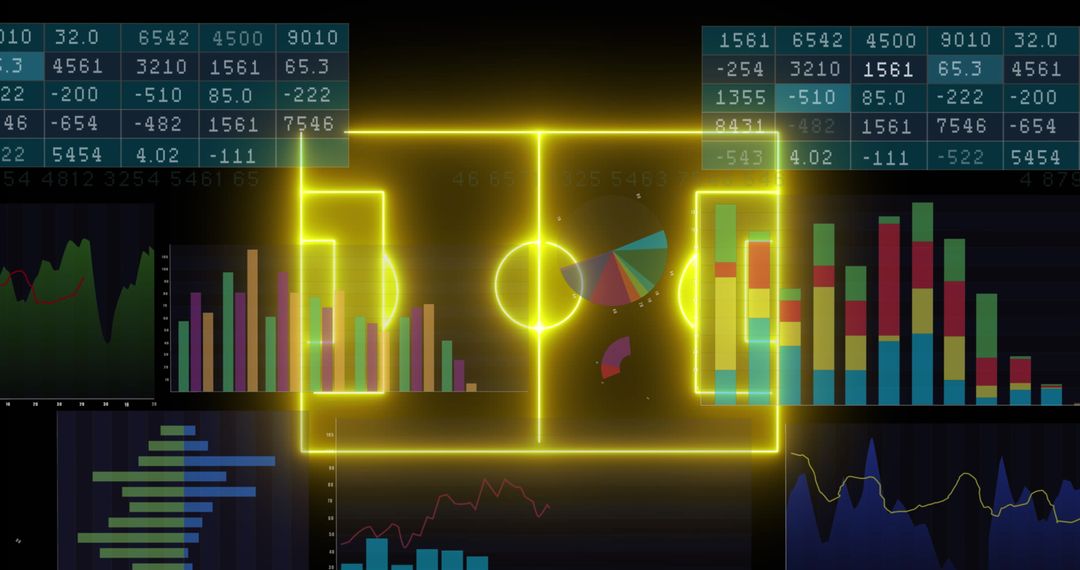
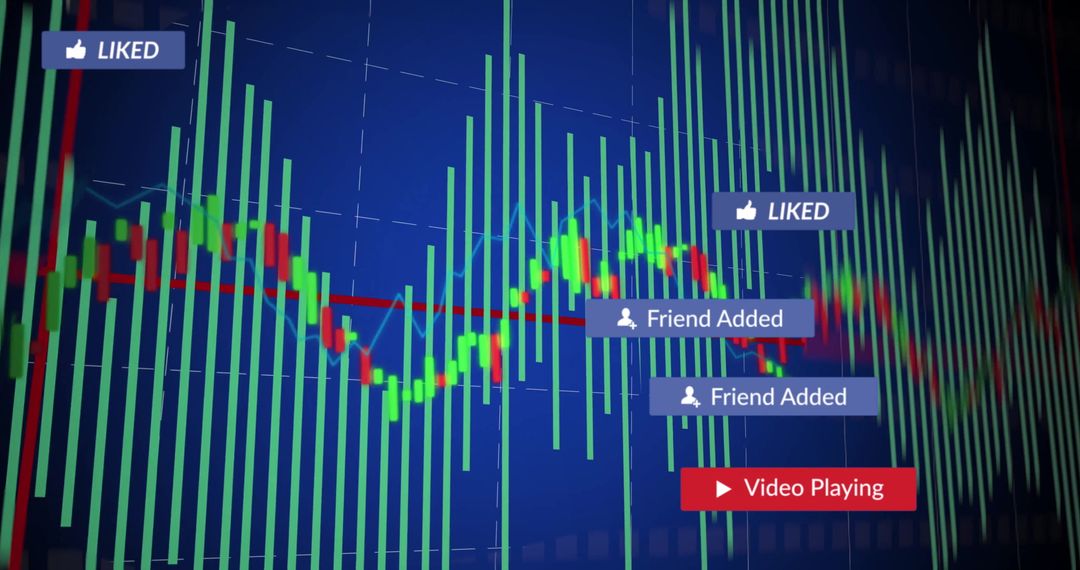
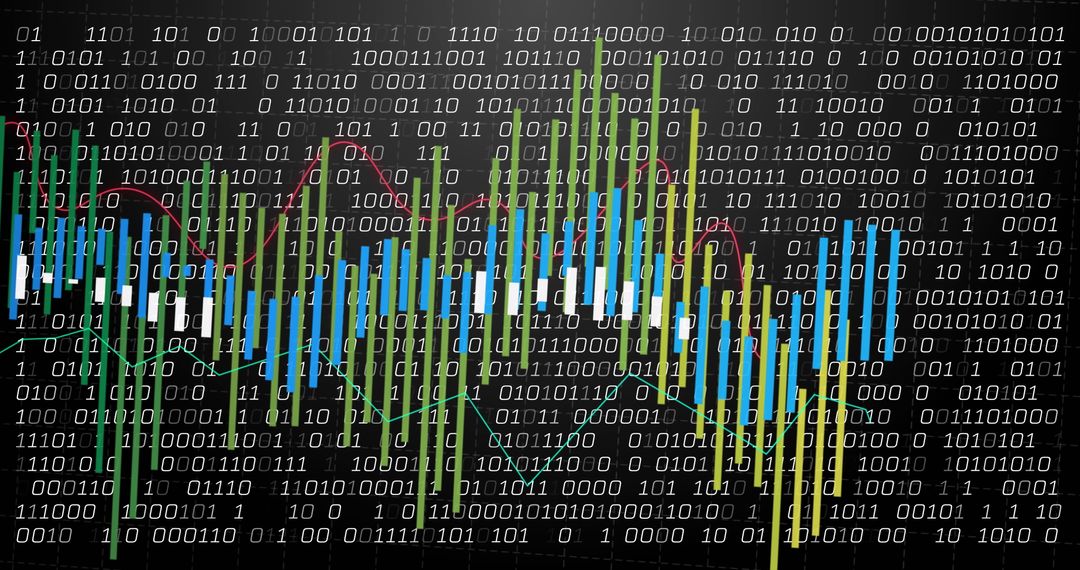
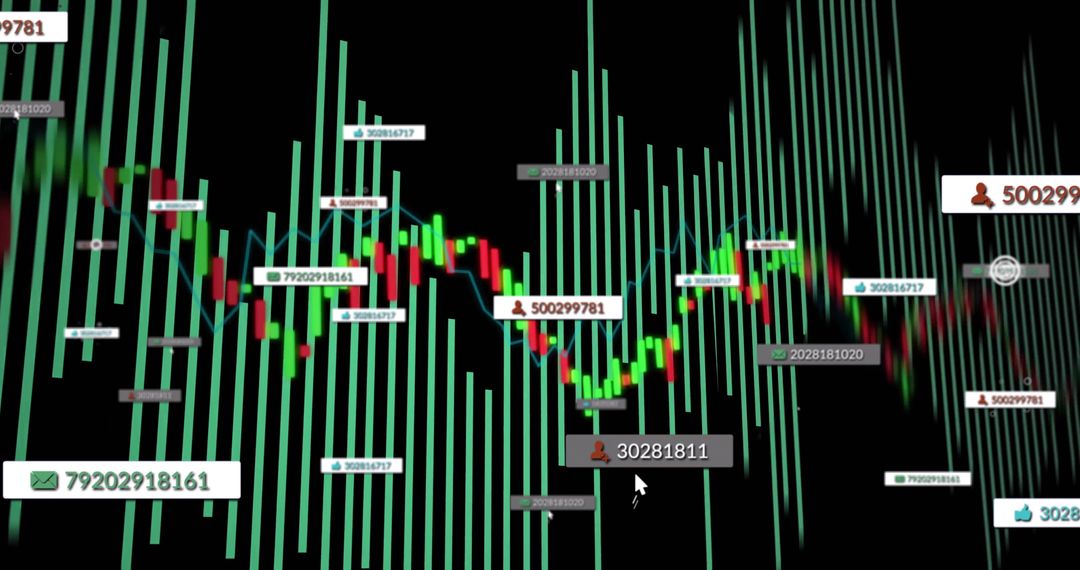
- Dynamic Financial Dashboard Featuring Candlestick and Line Charts
Dynamic Financial Dashboard Featuring Candlestick and Line Charts Image
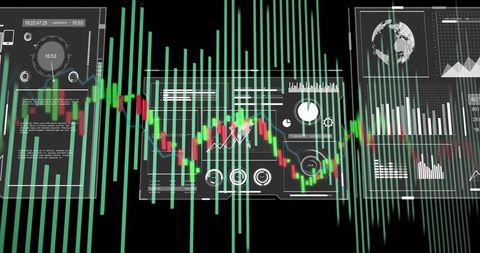
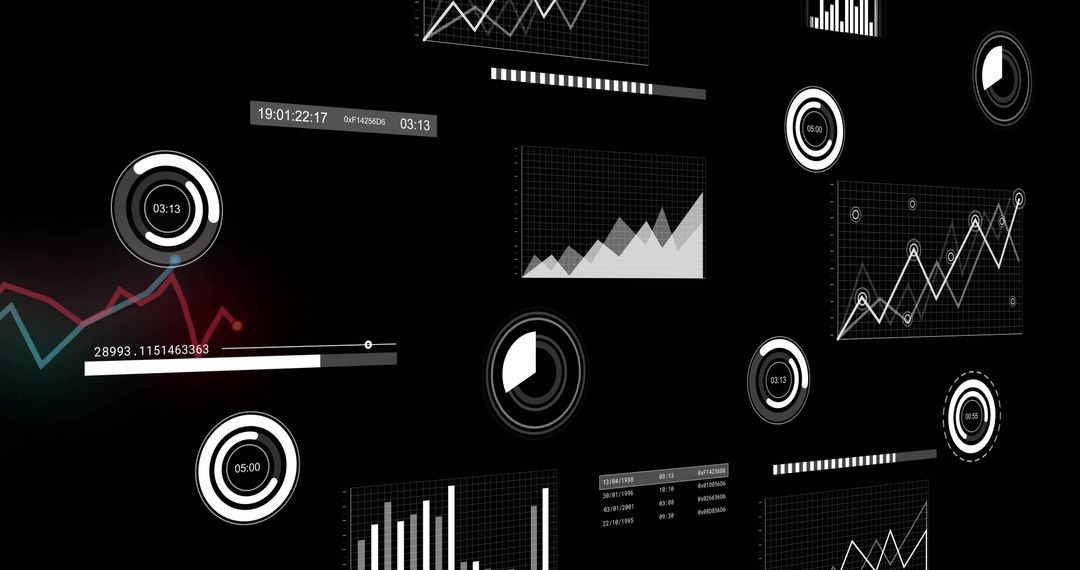
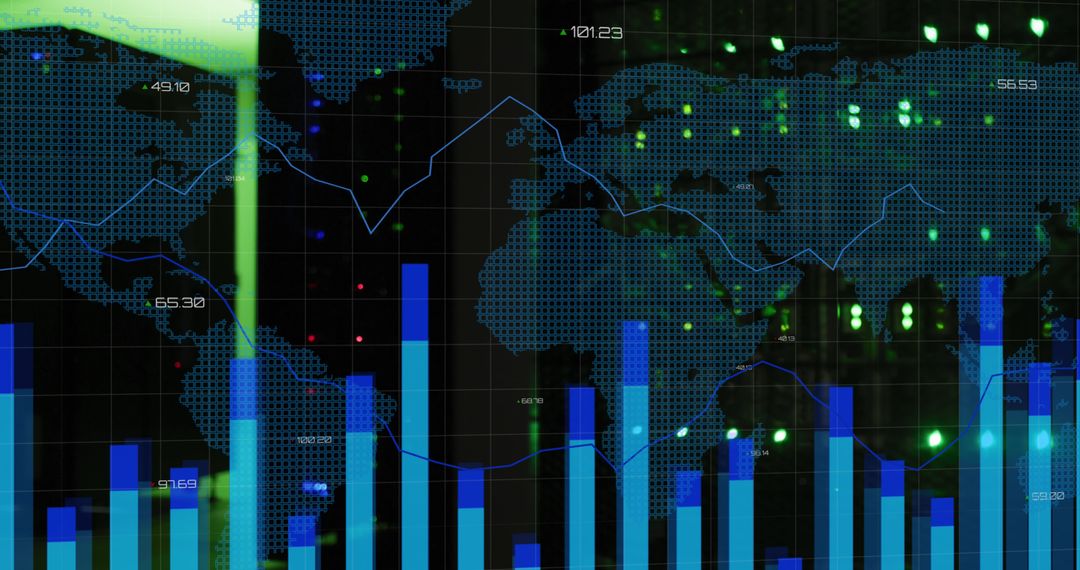
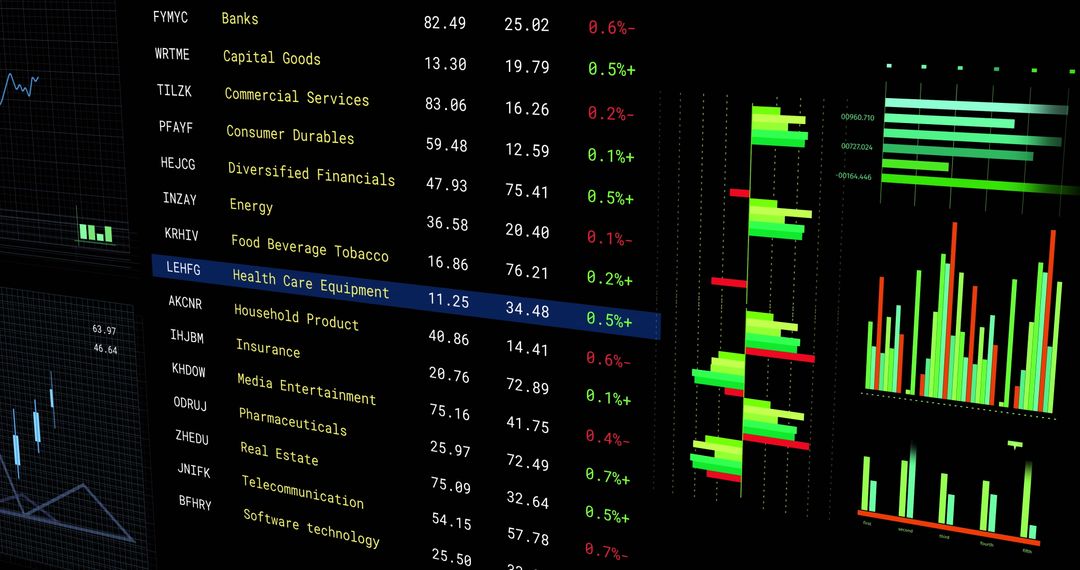
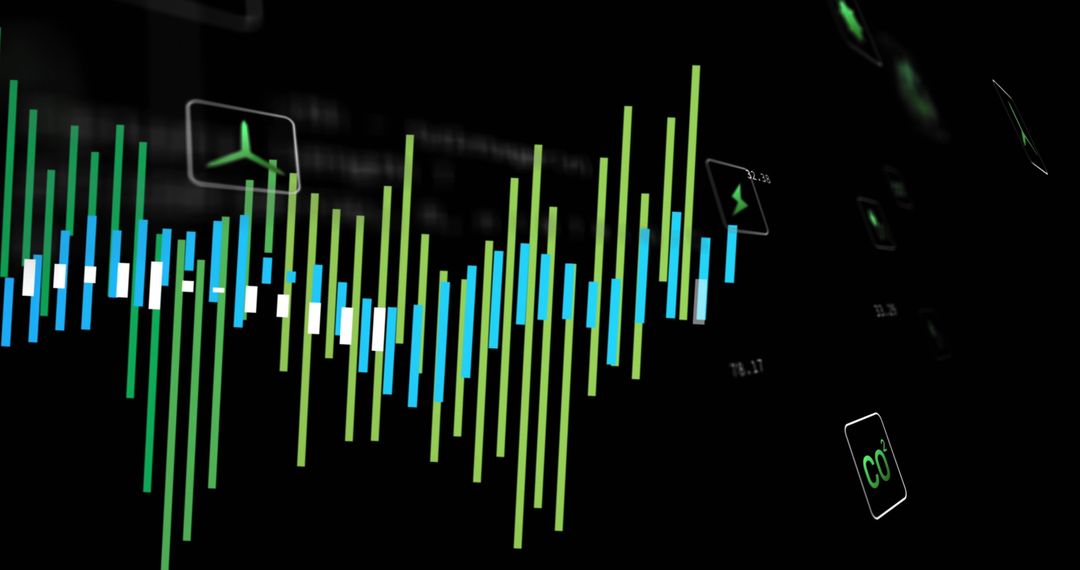
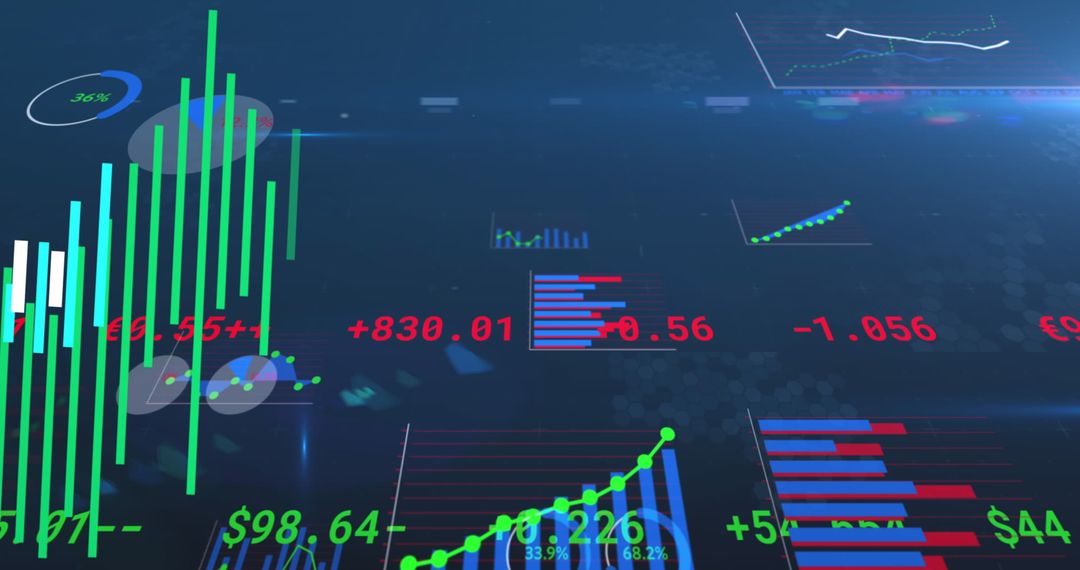
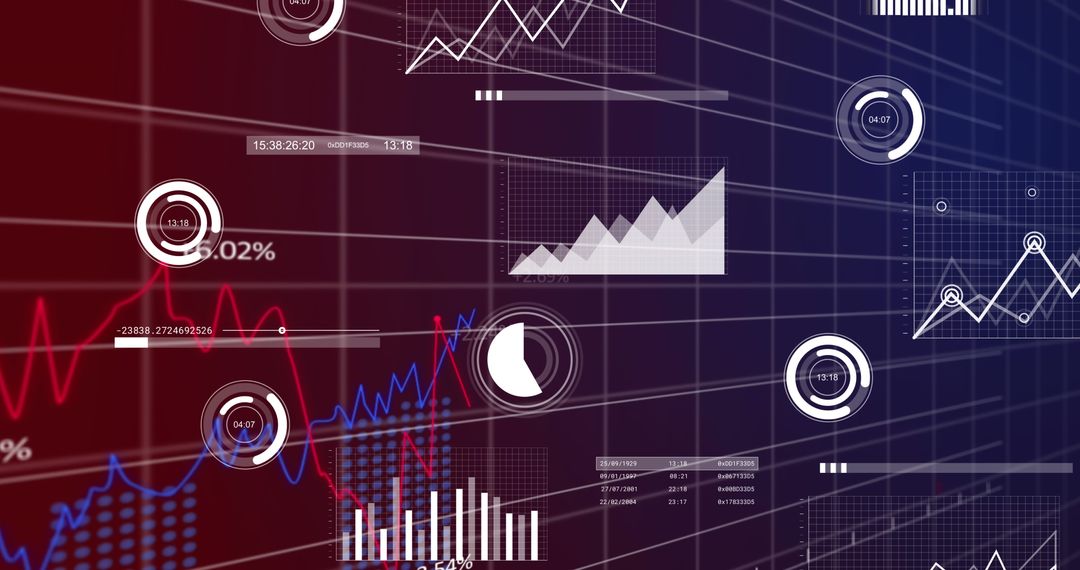
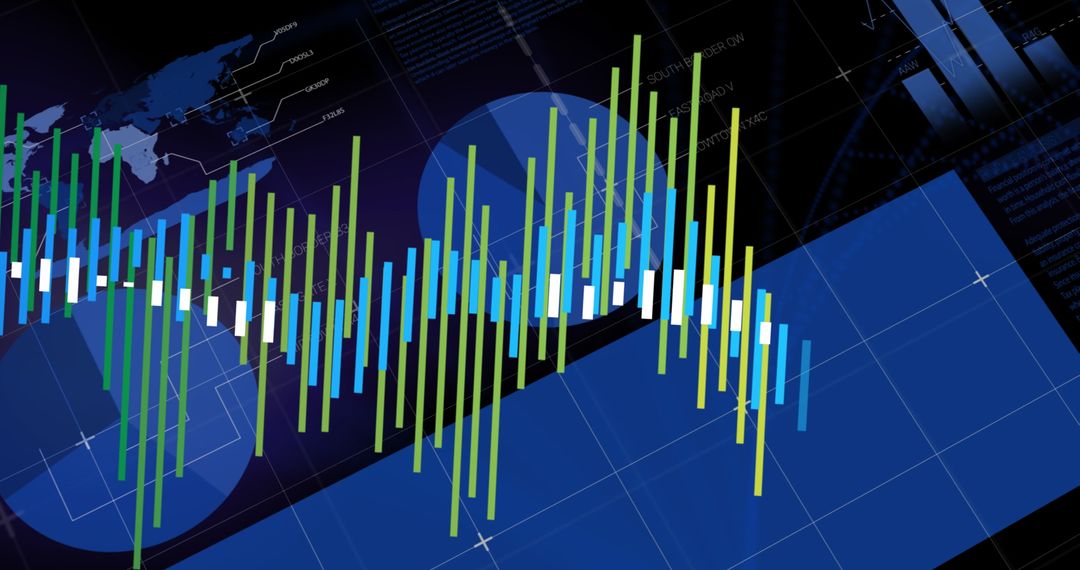
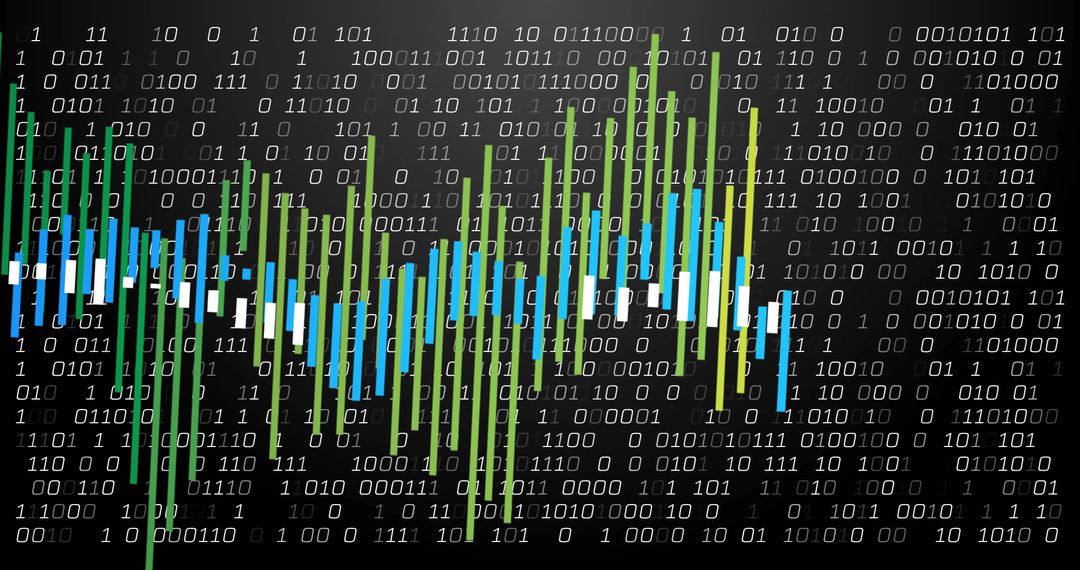
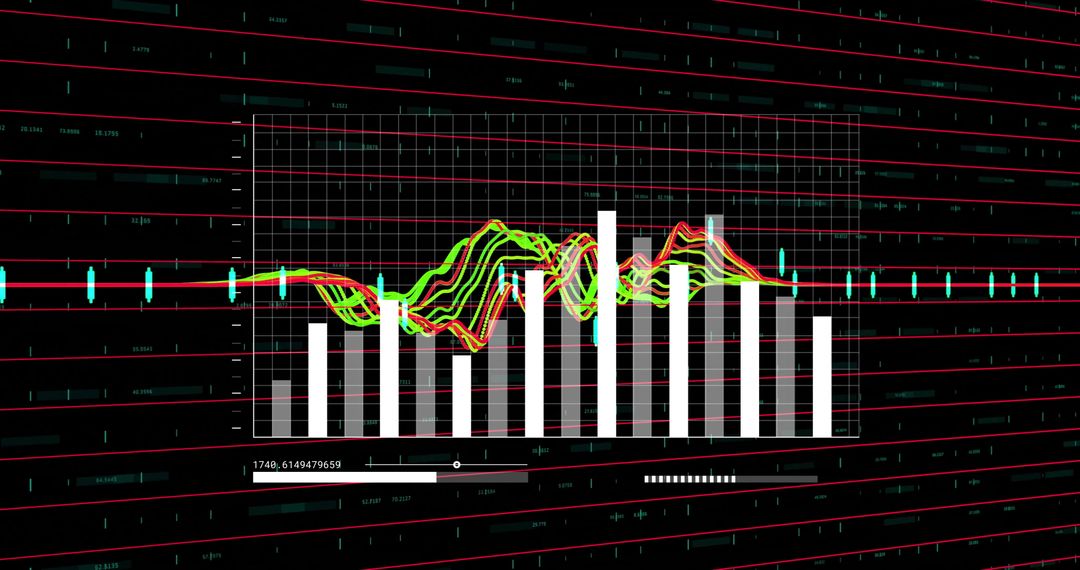
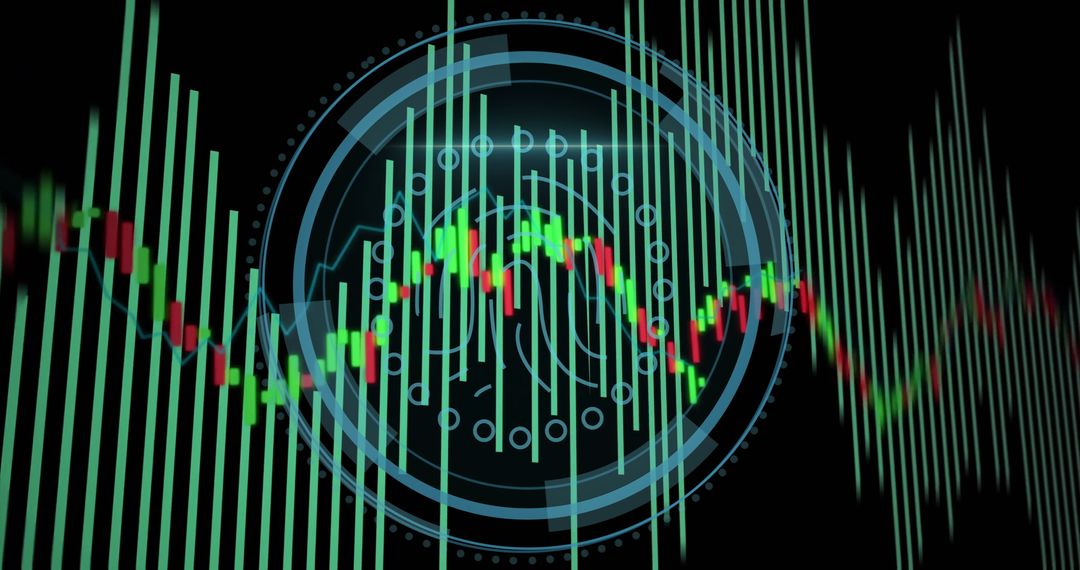
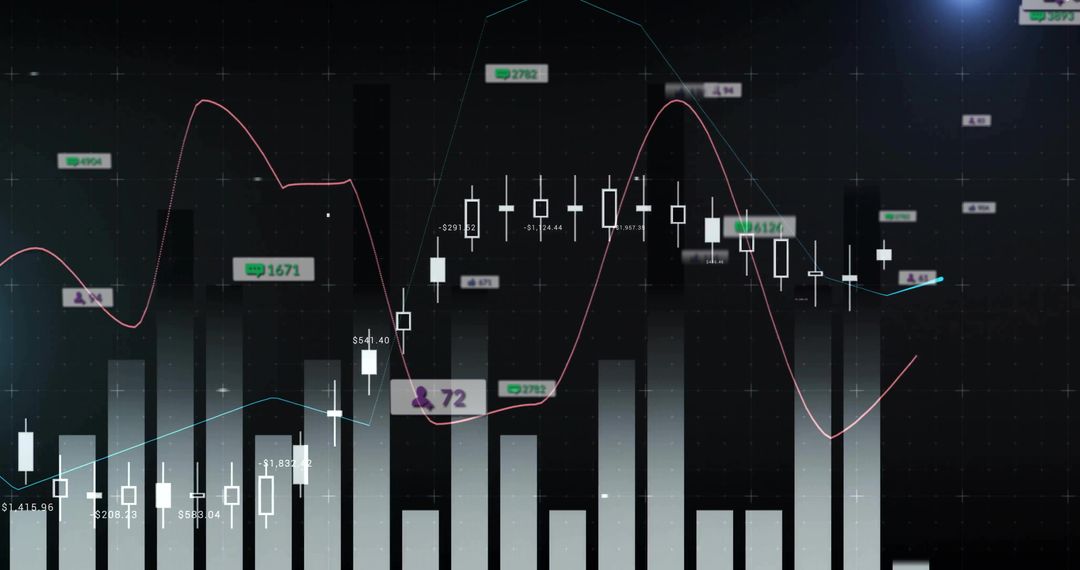
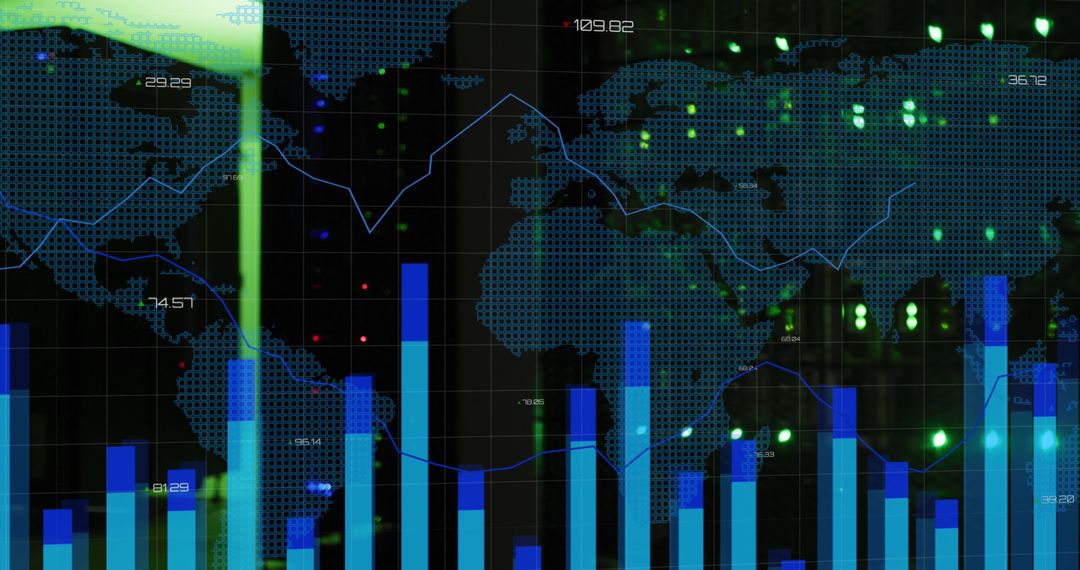
The dynamic and futuristic representation of financial analytics captured with digital dashboard visuals can enhance presentations related to market research, financial reporting, and investment discussions. This style appeals to professionals in fintech, traders, or analysts showcasing market trends or related segments in conferences or reports.
Powered by  - Get 15% off with code: PIKWIZARD15


6
downloads
downloads
Tags:
More
Credit Photo
If you would like to credit the Photo, here are some ways you can do so
Text Link
photo Link
<span class="text-link">
<span>
<a target="_blank" href=https://pikwizard.com/photo/dynamic-financial-dashboard-featuring-candlestick-and-line-charts/6e6f3344be5bdc9ead2ef0577eda34b0/>PikWizard</a>
</span>
</span>
<span class="image-link">
<span
style="margin: 0 0 20px 0; display: inline-block; vertical-align: middle; width: 100%;"
>
<a
target="_blank"
href="https://pikwizard.com/photo/dynamic-financial-dashboard-featuring-candlestick-and-line-charts/6e6f3344be5bdc9ead2ef0577eda34b0/"
style="text-decoration: none; font-size: 10px; margin: 0;"
>
<img src="https://pikwizard.com/pw/medium/6e6f3344be5bdc9ead2ef0577eda34b0.jpg" style="margin: 0; width: 100%;" alt="" />
<p style="font-size: 12px; margin: 0;">PikWizard</p>
</a>
</span>
</span>
Free (free of charge)
Free for personal and commercial use.
Author: People Creations
Similar Free Stock Images
Premium


Premium


Premium


Premium


Premium


Premium


Premium


Premium


Premium


Premium


Premium

Premium


Premium


Premium


Premium


Premium


Premium


Premium


Premium


Premium


Premium


Premium


Premium


Premium

