
- Home >
- Stock Photos >
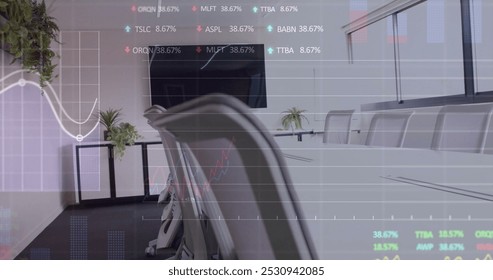
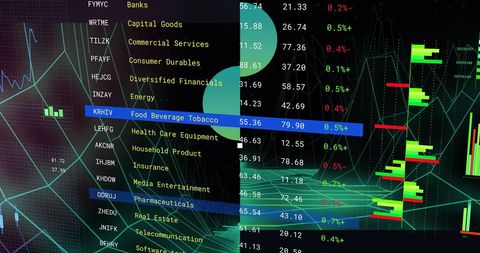
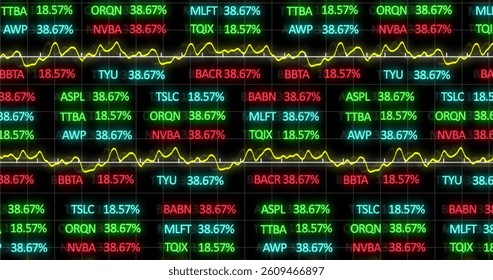
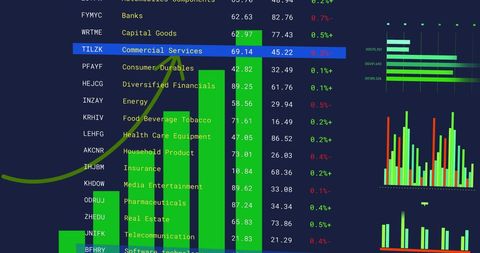
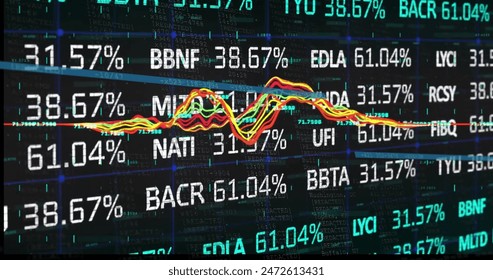
- Dynamic Financial Data Analysis Interface Display
Dynamic Financial Data Analysis Interface Display Image

Visualizing dynamic financial information on screen, this digital interface representation is rich with data visualization such as charts, forex analysis, and market trends. Ideal for use in articles, presentations, or projects relating to finance, stock trading, and economic datasets.
Powered by  - Get 15% off with code: PIKWIZARD15


downloads
Tags:
More
Credit Photo
If you would like to credit the Photo, here are some ways you can do so
Text Link
photo Link
<span class="text-link">
<span>
<a target="_blank" href=https://pikwizard.com/photo/dynamic-financial-data-analysis-interface-display/0c35dacf38ba655ca1fe97ed96480853/>PikWizard</a>
</span>
</span>
<span class="image-link">
<span
style="margin: 0 0 20px 0; display: inline-block; vertical-align: middle; width: 100%;"
>
<a
target="_blank"
href="https://pikwizard.com/photo/dynamic-financial-data-analysis-interface-display/0c35dacf38ba655ca1fe97ed96480853/"
style="text-decoration: none; font-size: 10px; margin: 0;"
>
<img src="https://pikwizard.com/pw/medium/0c35dacf38ba655ca1fe97ed96480853.jpg" style="margin: 0; width: 100%;" alt="" />
<p style="font-size: 12px; margin: 0;">PikWizard</p>
</a>
</span>
</span>
Free (free of charge)
Free for personal and commercial use.
Author: Awesome Content
Similar Free Stock Images
Premium


Premium

Premium


Premium


Premium


Premium


Premium


Premium

Premium

Premium

Premium


Premium

AI


Premium


Premium


Premium


Premium


Premium


Premium

Premium


Premium


Premium


Premium

Premium


Premium


Premium


Explore More Free Stock Images