- Home >
- Stock Photos >
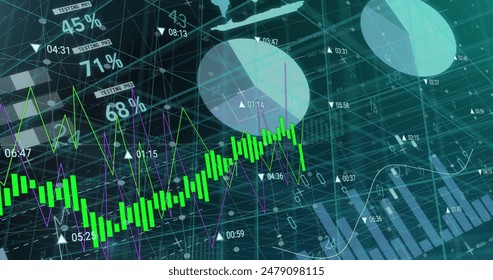
- Dynamic Financial Data Analytics with Stock Market Trends
Dynamic Financial Data Analytics with Stock Market Trends Image

Visualizing complex financial data with stock market trends and glowing shapes overlaid for analyzing market movements. Useful for business presentations, stock market reports, educational purposes on data analytics, and financial forecasting.
Powered by  - Get 15% off with code: PIKWIZARD15


2
downloads
downloads
Tags:
More
Credit Photo
If you would like to credit the Photo, here are some ways you can do so
Text Link
photo Link
<span class="text-link">
<span>
<a target="_blank" href=https://pikwizard.com/photo/dynamic-financial-data-analytics-with-stock-market-trends/9b669bb50594d4b0c711020931dc5355/>PikWizard</a>
</span>
</span>
<span class="image-link">
<span
style="margin: 0 0 20px 0; display: inline-block; vertical-align: middle; width: 100%;"
>
<a
target="_blank"
href="https://pikwizard.com/photo/dynamic-financial-data-analytics-with-stock-market-trends/9b669bb50594d4b0c711020931dc5355/"
style="text-decoration: none; font-size: 10px; margin: 0;"
>
<img src="https://pikwizard.com/pw/medium/9b669bb50594d4b0c711020931dc5355.jpg" style="margin: 0; width: 100%;" alt="" />
<p style="font-size: 12px; margin: 0;">PikWizard</p>
</a>
</span>
</span>
Free (free of charge)
Free for personal and commercial use.
Author: Creative Art
Similar Free Stock Images

Premium


Premium


Premium


Premium


Premium


Premium


Premium


Premium


Premium


Premium


Premium


Premium


Premium


Premium


Premium


Premium


Premium


Premium


Premium


Premium


Premium


Premium


Premium


Premium