
- Home >
- Stock Photos >
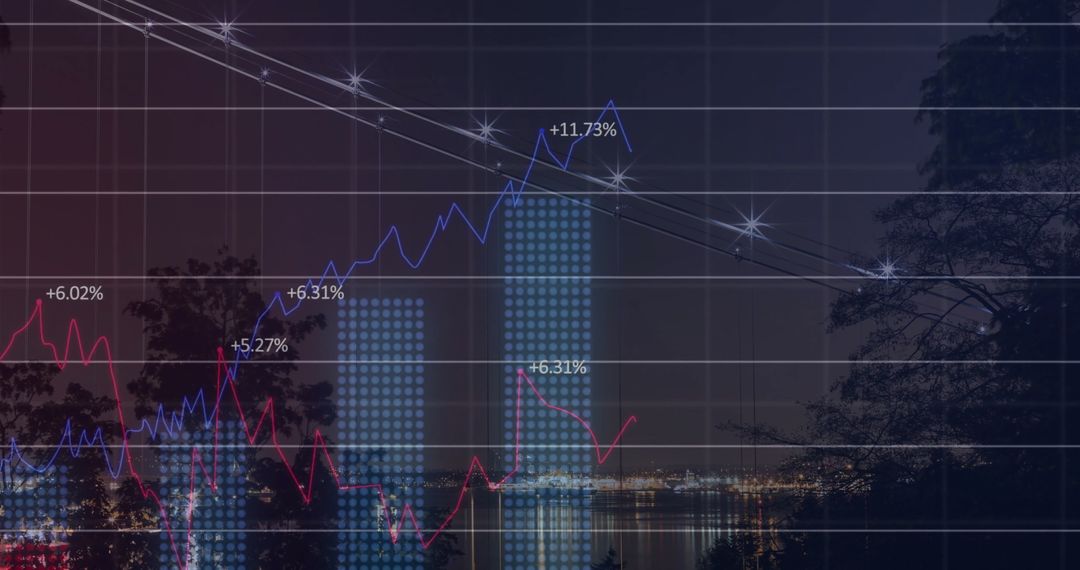
- Dynamic Financial Data Chart with Currency Symbols
Dynamic Financial Data Chart with Currency Symbols Image
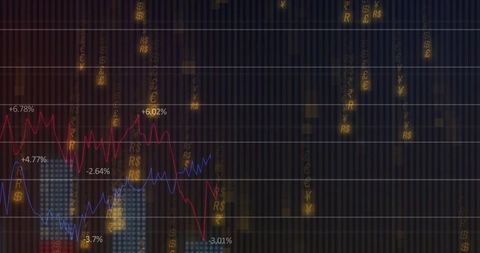
Financial data visualization with red and blue lines displaying market trends alongside prevalent global currency symbols like dollar, euro, yen, and rupee. This representation of analytics and economic signals, useful for trading, investment presentations, economic analysis, and depicting business metrics. Suitable for financial blogs, fintech applications, or technology websites focusing on market updates.
Powered by  - Get 15% off with code: PIKWIZARD15


0
downloads
downloads
Tags:
More
Credit Photo
If you would like to credit the Photo, here are some ways you can do so
Text Link
photo Link
<span class="text-link">
<span>
<a target="_blank" href=https://pikwizard.com/photo/dynamic-financial-data-chart-with-currency-symbols/e872855ce9d12b79a6190c3e54f394fd/>PikWizard</a>
</span>
</span>
<span class="image-link">
<span
style="margin: 0 0 20px 0; display: inline-block; vertical-align: middle; width: 100%;"
>
<a
target="_blank"
href="https://pikwizard.com/photo/dynamic-financial-data-chart-with-currency-symbols/e872855ce9d12b79a6190c3e54f394fd/"
style="text-decoration: none; font-size: 10px; margin: 0;"
>
<img src="https://pikwizard.com/pw/medium/e872855ce9d12b79a6190c3e54f394fd.jpg" style="margin: 0; width: 100%;" alt="" />
<p style="font-size: 12px; margin: 0;">PikWizard</p>
</a>
</span>
</span>
Free (free of charge)
Free for personal and commercial use.
Author: Authentic Images
Similar Free Stock Images

Premium


Premium


Premium


Premium


Premium


Premium


Premium


Premium


Premium


Premium


Premium


Premium


Premium


Premium


Premium


Premium


Premium


Premium


Premium


Premium


Premium


Premium


Premium


Premium

