
- Home >
- Stock Photos >
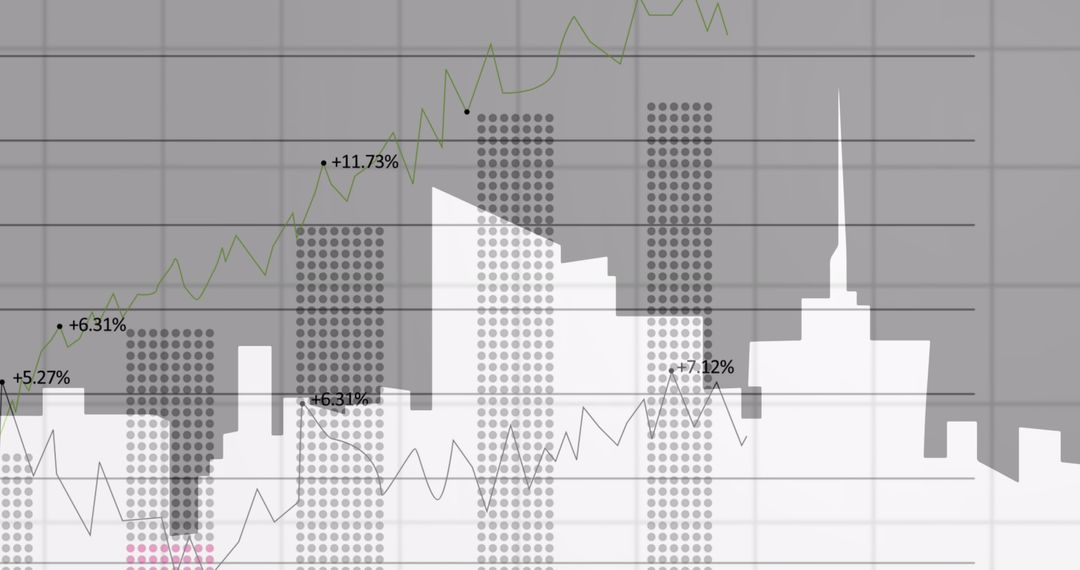
- Dynamic Financial Data Chart with Rising Growth Indicator
Dynamic Financial Data Chart with Rising Growth Indicator Image

Chart illustrates rising financial data, essential for visualizing growth in business or investments. Useful for presentations, reports on economic trends, or analyzing market projections in corporate contexts.
Powered by  - Get 15% off with code: PIKWIZARD15


0
downloads
downloads
Tags:
More
Credit Photo
If you would like to credit the Photo, here are some ways you can do so
Text Link
photo Link
<span class="text-link">
<span>
<a target="_blank" href=https://pikwizard.com/photo/dynamic-financial-data-chart-with-rising-growth-indicator/4d21a22781c4012f38de47e0e8cfde38/>PikWizard</a>
</span>
</span>
<span class="image-link">
<span
style="margin: 0 0 20px 0; display: inline-block; vertical-align: middle; width: 100%;"
>
<a
target="_blank"
href="https://pikwizard.com/photo/dynamic-financial-data-chart-with-rising-growth-indicator/4d21a22781c4012f38de47e0e8cfde38/"
style="text-decoration: none; font-size: 10px; margin: 0;"
>
<img src="https://pikwizard.com/pw/medium/4d21a22781c4012f38de47e0e8cfde38.jpg" style="margin: 0; width: 100%;" alt="" />
<p style="font-size: 12px; margin: 0;">PikWizard</p>
</a>
</span>
</span>
Free (free of charge)
Free for personal and commercial use.
Author: Creative Art
Similar Free Stock Images

Premium


Premium


Premium


Premium


Premium


Premium


Premium


Premium


Premium


Premium


Premium


Premium


Premium


Premium


Premium


Premium


Premium


Premium


Premium


Premium


Premium


Premium


Premium


Premium

