
- Home >
- Stock Photos >
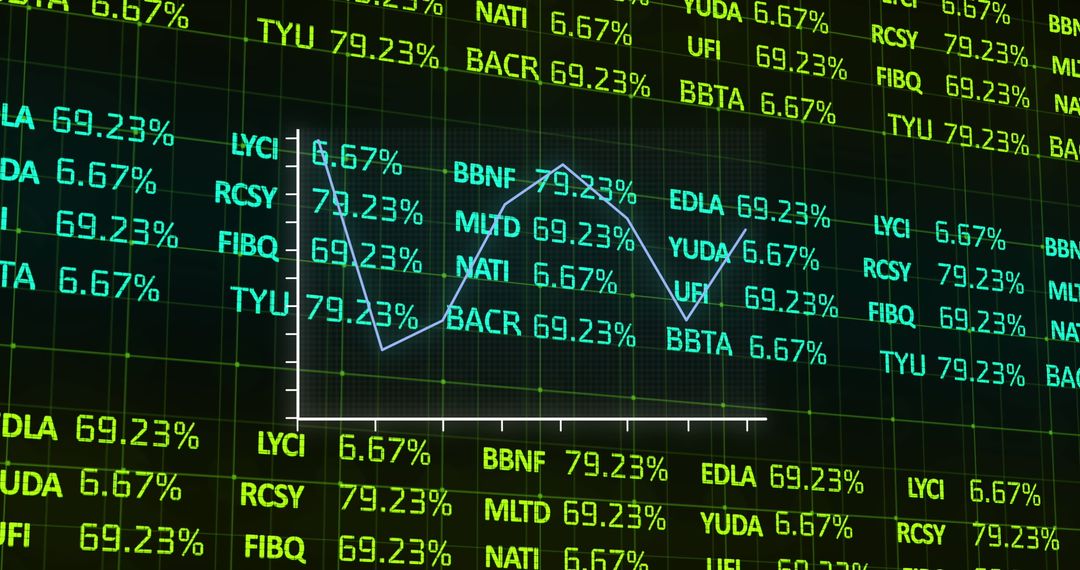
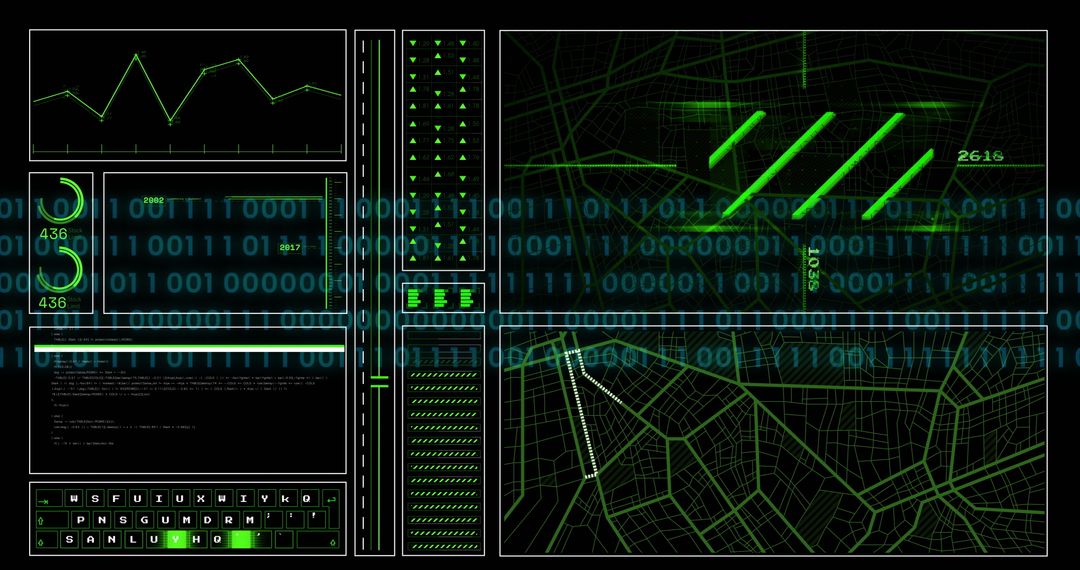
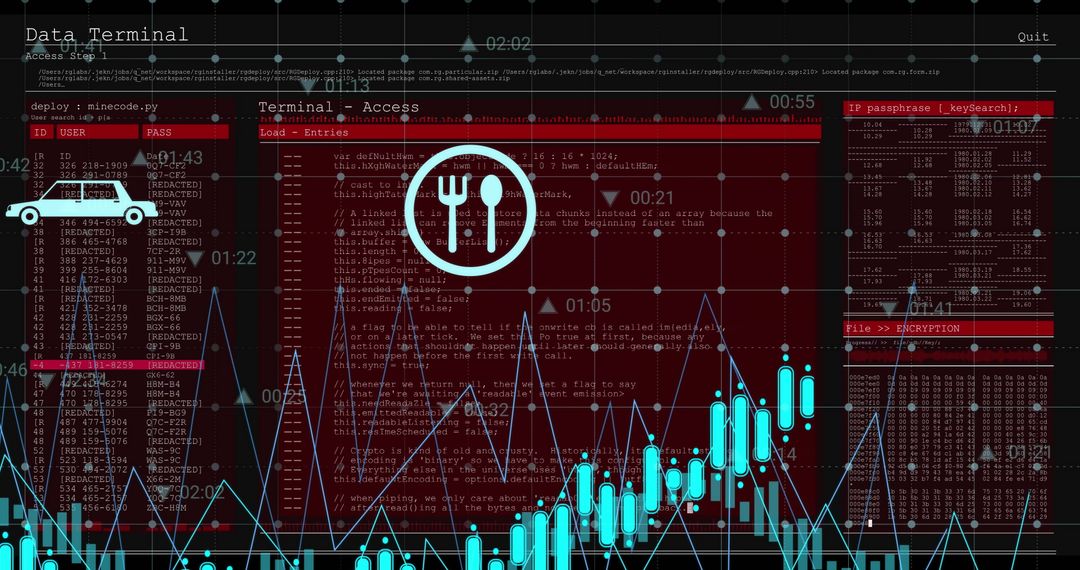
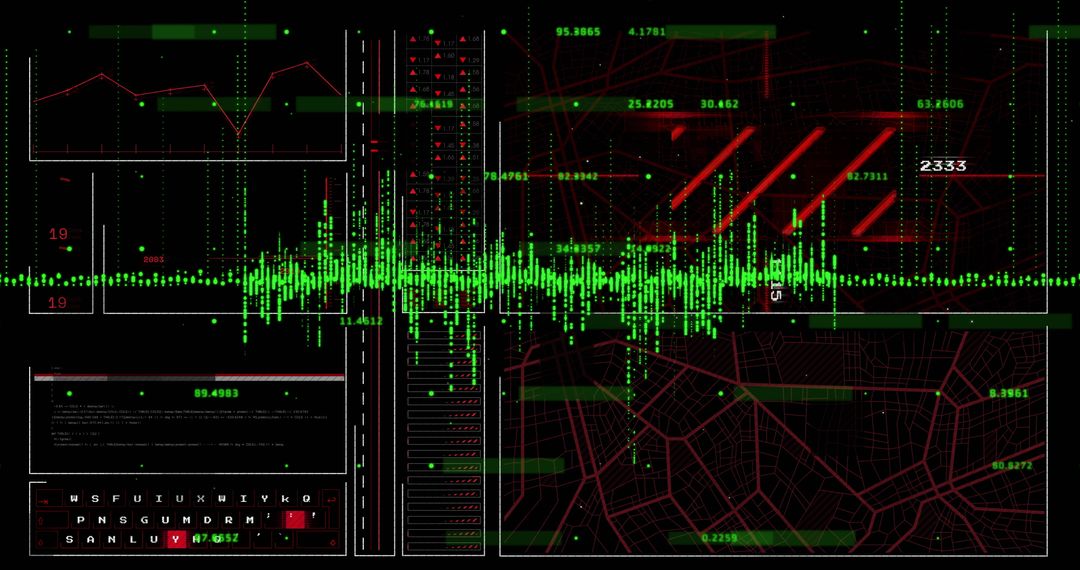
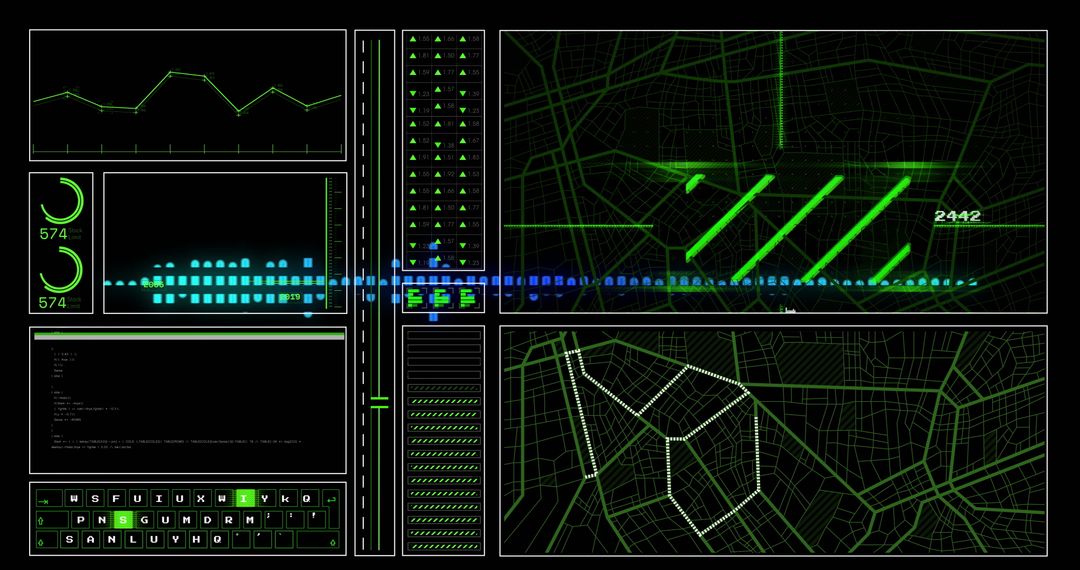
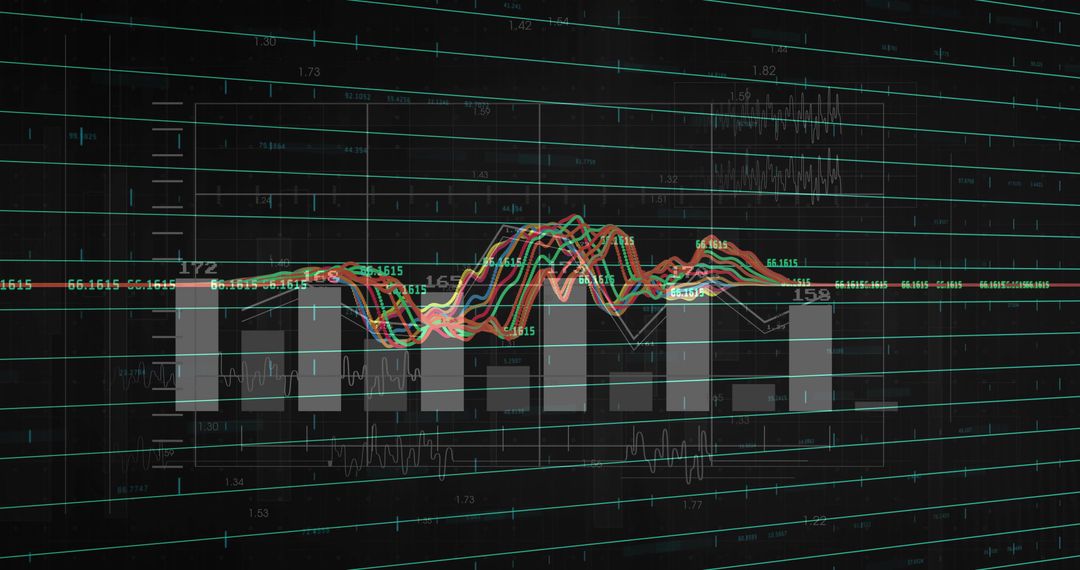
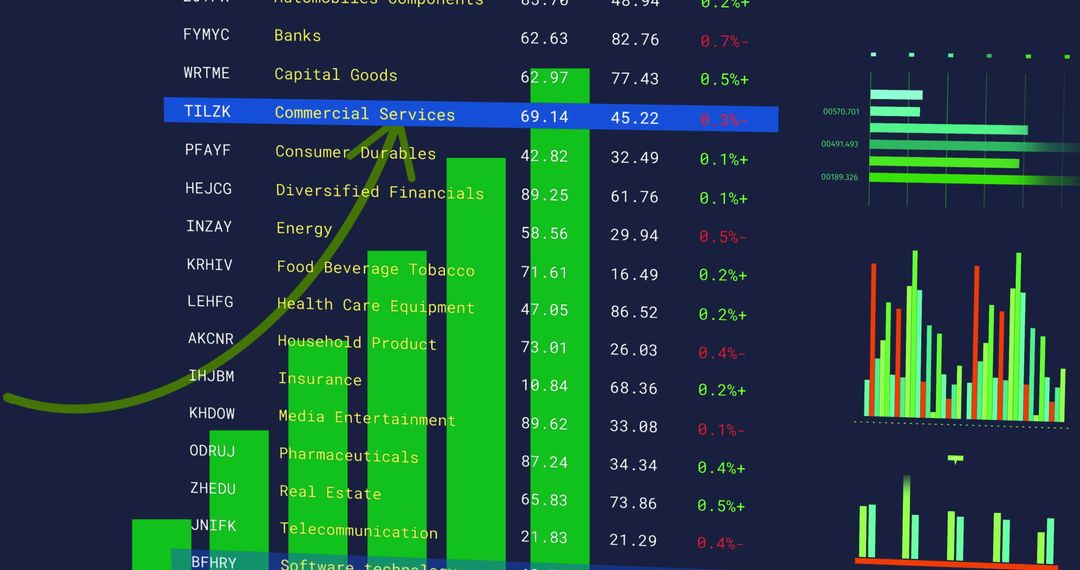
- Dynamic Financial Data Charts on Black Screen Visualizing Global Market Trends
Dynamic Financial Data Charts on Black Screen Visualizing Global Market Trends Image

Visual representation of complex financial charts overlaying a black screen, capturing dynamic market trends and statistics. Ideal for use in business websites or presentations focused on global market analysis, economic strategies, or investment opportunities. Useful for visualizing financial software tools in advertisements or brochures.
Powered by 


2
downloads
downloads
Tags:
More
Credit Photo
If you would like to credit the Photo, here are some ways you can do so
Text Link
photo Link
<span class="text-link">
<span>
<a target="_blank" href=https://pikwizard.com/photo/dynamic-financial-data-charts-on-black-screen-visualizing-global-market-trends/d4f5c8609db0171d4fe48b5a5068f2ee/>PikWizard</a>
</span>
</span>
<span class="image-link">
<span
style="margin: 0 0 20px 0; display: inline-block; vertical-align: middle; width: 100%;"
>
<a
target="_blank"
href="https://pikwizard.com/photo/dynamic-financial-data-charts-on-black-screen-visualizing-global-market-trends/d4f5c8609db0171d4fe48b5a5068f2ee/"
style="text-decoration: none; font-size: 10px; margin: 0;"
>
<img src="https://pikwizard.com/pw/medium/d4f5c8609db0171d4fe48b5a5068f2ee.jpg" style="margin: 0; width: 100%;" alt="" />
<p style="font-size: 12px; margin: 0;">PikWizard</p>
</a>
</span>
</span>
Free (free of charge)
Free for personal and commercial use.
Author: Creative Art
Similar Free Stock Images

Premium


Premium


Premium


Premium


Premium


Premium


Premium


Premium


Premium


Premium


Premium


Premium


Premium


Premium


Premium


Premium


Premium


Premium


Premium


Premium


Premium


Premium


Premium


Premium

