1. Home > 
  2. Stock Photos > 
  3. Dynamic Financial Data Visualization with Binary Code Overlay

Dynamic Financial Data Visualization with Binary Code Overlay Image

Dynamic Financial Data Visualization with Binary Code Overlay

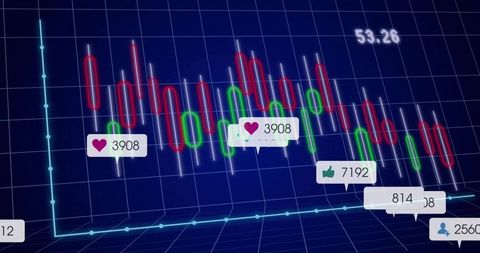
Commingling vibrant bar and line graphs with layers of binary codes, depicting data fluctuations. Ideal for presentations, articles, and resources related to finance, stock market analysis, or contemporary tech in trading. Highlights dynamics of digital finance and visual storytelling in analytics.

Powered by Shutterstock logo - Get 15% off with code: PIKWIZARD15
Big data visualization concept. Machine learning algorithms. Analysis of information. Technology data and binary code network conveying connectivity, complexity and data flood of modern digital age. - Powered by Shutterstock - Get 15% off with code: PIKWIZARD15Overlaying digital binary code on modern bank skyscrapers, representing financial technology. Fintech, innovation, finance, data, future - Powered by Shutterstock - Get 15% off with code: PIKWIZARD15Digital transformation concept. Statistics of business. Finance chart. Financial planning. Data analysis.  - Powered by Shutterstock - Get 15% off with code: PIKWIZARD15Data Management System (DMS) and Business Analytics concept with servers connected to dashboard to provide information for Key Performance Indicators (KPI), person in background, marketing analysis - Powered by Shutterstock - Get 15% off with code: PIKWIZARD15Person using a laptop with financial data visualizations and binary code on a dark background. Concept of fintech and algorithmic trading - Powered by Shutterstock - Get 15% off with code: PIKWIZARD15

Credit Photo

If you would like to credit the Photo, here are some ways you can do so

Free (free of charge)

Free for personal and commercial use.

Author: People Creations

Similar Free Stock Images

Dynamic Financial Data Display in Digital Space
Premium
Chess pieces on board in neon lights. Circuit board pattern and binary code symbolizing artificial intelligence
Dynamic Financial Data Graph on Blue Digital Background
Abstract Financial Market Data Analysis Visualization
Dynamic Financial Fluctuation on Digital Graph
Fluctuating Digital Stock Market Data Chart
Premium
Programmer developer screen concept. Abstract dark blue background with binary code, programming concept. Blue color. Elearning concept with internet related words. Encrypted data. Binary code.
Digital Financial Data with Graph and Grid Patterns
Dynamic Financial Charts and Graphs Indicating Market Trends
Digital Financial Data Overlay on Urban Street Scene
Rising Graphs and Interactive Financial Data Analytics Background
Premium
Business analytics, finance, neural network, AI,Big data technology and data science. Data scientist querying, analysing and visualizing
Abstract Digital Financial Data Chart with Pink Line Oscillations
Dynamic Forex Trading Graphs with Increasing Numbers
Financial Growth Graph and Data Analytics Representation
Social Media and Stock Data Integration with Digital Graphics
Premium
Image of financial data processing and binary coding over wind turbines. Global data processing, sustainability and environment concept digitally generated image.
Dynamic Statistical Data Analysis with Gradient Colors
Digital Graph with Rising and Falling Lines on Grid Background
Colorful Financial Data Display Against Blue Grid Background
Data Visualization on Blue Digital Interface
Premium
Image of financial data and globe over binary code on blue background. Global finance, economy and computers concept digitally generated image.
Global Financial Data on Virtual Screen Displaying Stock Market Trends
Tech Growth Analysis with Dynamic Data Visualization
Abstract Financial Data Charts Reflecting Economic Trends
Abstract Financial Data Processing and Analysis Interface
Premium
Hand using a pen to interact with digital financial charts and algorithmic lines on a dark background. Concept of fintech and automated trading interface
Analyzing Stock Market Trends with Candlestick Chart and Data Visualization
Candlestick Chart Visualization with Indicators and Growth Highlight
3D Candlestick Chart with Social Media Reactions
Colorful Candlestick Chart on Trading Interface
Digital Interface with Data Graphs and JavaScript Code
Financial Data Analysis with Global Digital Interface
Premium
Businessman in suit using tablet with digital data, binary code, and virtual analytics on dark background. Concept of technology and networking
Futuristic Digital Data Analytics Interface Display
Dynamic Financial Graph Visualizing Market Trends
Green Line Rising on Digital Trading Board with Abstract Background
Abstract Financial Charts with Graphs and Data Visualization
Premium
Software engineering working on big data digital information innovation technology analysis network system cyberspace binary code flow futuristic statistic business design concept computer model
Dynamic Financial Growth Digital Chart Display
Data Analytics Graphs on Digital Interface Background
Holographic Financial Graph with Dynamic Line Chart
Digital Stock Market Green Graph Against Dark Trading Board
Premium
Man in glasses thinking, surrounded by futuristic digital swirl patterns and data streams, symbolizing innovation, technology, artificial intelligence, and deep analytical thinking.
Digital Data Visualization with Trend Lines and Percentage Changes
Abstract Data Visualization with Dynamic Charts and Graphs
Financial Graphs with Social Media Analytics on Digital Chart
Dynamic Financial Data Visualization on Digital Grid Background
Premium
Hand pressing calculator with financial charts, binary code, and rising trend lines on a blurred office background, representing investment analysis
Dynamic Financial Graphs with Glowing Lens Flares and Data Points
Digital Cityscape with Financial Data Overlay
Data Visualization on Digital Grid with Technological Interface
Financial Data Analysis on Blue Digital Interface
Premium
Business Analytics Finance Neural Network AI Big Data Technology Data scientists query, analyze, and visualize complex datasets on a virtual screen. information flow concept processing of bigdata
Real-Time Financial Data Analysis with Graphs and Charts
Global Financial Data Analysis Visualized with Futuristic Interface
Abstract Data Visualization Digital Chart Background
Dynamic Financial Data Chart Showing Trend Analysis
Premium
Image of financial data processing binary coding over wind turbines. global environment, sustainability and finance concept digitally generated image.
Financial Analysis Concept with Modern Chart Display
Neon Fingerprint Lock Overlaying Red and Green Candlesticks on Digital Grid
Futuristic Data Visualization with Neon Grid and Line Charts
Digital Finance Data Overlaying Futuristic Cityscape
Complex Financial Data Analysis on Purple Grid Background
Financial Data Analysis with Dynamic Graph on Blue Background
Premium
Person typing on laptop with virtual data, binary code, and stats overlay on abstract background. Concept of digital technology and analytics
Rising Digital Graph and Data Visualizations on Black Background
Financial Growth Chart Displaying Performance Trends
Abstract Digital Chart in Futuristic Financial Analysis Concept
Dynamic Stock Market Graphs and Financial Data
Premium
Spreadsheet bank accounts accounting with calculator and magnifying glass. Concept for financial fraud investigation, audit and analysis.
Digital Graphs Representing Data and Analytics on Black Background
Global Finance and COVID-19 Impact Representation
Rising Financial Graph on Purple Background
Digital Financial Data Processing with Graphs and Charts
Premium
futuristic digital visualization of global import tariffs and trade data
Colorful Bar Graph with Data Overlay on Black Background
Dynamic Data Visualization with Financial Charts and 3D Elements
Abstract Financial Data Visualization with Graphs
Dynamic Lines Show Rising Financial Statistics Over Time
Premium
Spreadsheet bank accounts accounting with calculator and magnifying glass. Concept for financial fraud investigation, audit and analysis.
Abstract Data Visualization on Blue Background for Technology Concept
Data Analysis Graphics on Digital Grid Background
Digital Data and Financial Charts on White Background
Analyzing Financial Data on Digital World Map Background
Premium
Image of financial data processing binary coding over cityscape. Global business, finance and data processing concept digitally generated image.
Digital Analytics Visualization with Bar and Line Graphs
Abstract Digital Data Graph and Diagrams on Gray Background
Colorful Financial Data Visualization with Digital Graph Elements
Dynamic Analytics Chart with Colored Area Segments and Data Values
Premium
Image of financial data processing binary coding over earth and wind turbine. global environment, sustainability and finance concept digitally generated image.
Interactive Digital Infographic with Callouts and Graph Elements
Visualizing market volatility on navy gradient with magenta and blue trend lines, copy space
Financial Data Visualization Over Futuristic Cityscape
Interactive Financial Graph on Digital Grid Background
Dynamic Digital Data Analysis on Elevated Grid
3D Financial Market Analysis with Declining Stock Graph
Premium
futuristic digital visualization of global import tariffs and trade data
Abstract Financial Chart Background with Bar and Line Graphs
Financial Data Statistics Visualized in Urban Setting
Dynamic Data Graphs on Digital Interface Background
Futuristic Digital Cityscape with Data Interference
Premium
Digital technology industry concept development of programming and coding technologies. Encrypted data. Binary code. Javascript code. Black background space with multiple layers coding.
Digital Interface with Data Graphs and Charts on Blue Background
High-Tech Financial Data Analysis Display with Graphs
Visual Display of Abstract Financial Data
Digital Analysis of Financial Data with Dynamic Graphs
Premium
City of London view with matrix  concept and digital connections. Virtual connectivity of the city. Financial district skyline with matrix sky background at sunset
Rising Financial Data Graph on Digital Grid Background
Abstract Digital Charts with Social Media Metrics Rising
Futuristic Keyboard Analytics Display with Digital Graphs and Numbers
Futuristic Financial Data Analysis with Rising White Line Graph
Premium
Image of financial data and graph over binary code on blue background. Global finance, economy and computers concept digitally generated image.
Abstract Financial Data Analysis and Stock Market Trends
Global Business Finance Data Analysis Visualization
Green Line Graph Overlapping Data Server Racks in Technology Center
Dynamic Financial Data Overlaid on Grid Background
Premium
Financial data processing and binary coding over a globe against shopping cart in grocery store. Global finance and business technology concept
Financial Data with Molecular Background Concept
Dynamic Graphic of Financial Data Displayed on Graph
Cybersecurity Dashboard Displaying Code and Analytics Chart
Financial Growth Chart with Data Visualization Elements
Premium
Image of financial data processing binary coding over earth and wind turbine. global environment, sustainability and finance concept digitally generated image.
Candlestick trading chart displaying trend lines, indicators and percentage labels