1. Home > 
  2. Stock Photos > 
  3. Dynamic Financial Data Visualization with Charts and Arrows

Dynamic Financial Data Visualization with Charts and Arrows Image

Dynamic Financial Data Visualization with Charts and Arrows

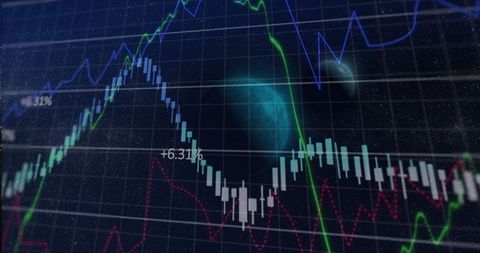
Vibrant and intricate display of financial data ideal for illustrating market trends on a financial blog, a presentation about stock market performance, or fintech analytic applications. Depicts dynamic graph movements and candlestick patterns in a modern, informative style that aides specialists in financial analysis and digital market representation.

Powered by Shutterstock logo - Get 15% off with code: PIKWIZARD15
Financial Expert Reviews Market Projections and Investment Strategies on Computer - Powered by Shutterstock - Get 15% off with code: PIKWIZARD15Businessman using laptop computer analyzing sales data and financial growth graph chart report. Business planning, strategy and development. Financial accounting. market research, data analysis - Powered by Shutterstock - Get 15% off with code: PIKWIZARD15Businessman's Hand Holding Holographic Stock Market Growth Chart with Green Arrow Showing Positive Financial Trends and Stock Candlestick Data on Digital Interface and Finance - Powered by Shutterstock - Get 15% off with code: PIKWIZARD15Woman hold smartphone use pc at workplace. Project stats financial data sales charts on laptop and cellphone screen, close up view over shoulder. Report preparation, synchronization for safety concept - Powered by Shutterstock - Get 15% off with code: PIKWIZARD15Two Traders Having a Meeting in a Modern Monitoring Office with Analytics Feed on a Big Digital Screen. Monitoring Room with Brokers and Finance Specialists Sit in Front of Computers. Colleagues Talk. - Powered by Shutterstock - Get 15% off with code: PIKWIZARD15

Credit Photo

If you would like to credit the Photo, here are some ways you can do so

Free (free of charge)

Free for personal and commercial use.

Author: Creative Art

Similar Free Stock Images

Colorful Stock Market Display with Graphs and Tickers on Blue Background
Premium
Man look at the dashboard with graphs and charts. Concept of data management system, business intelligence, data statistics, marketing analysis, key performance indicators (KPI) and analytics.
Financial Graphs with Cityscape Background Reflecting Market Trends
Dynamic Financial Data Processing Showing Stock Market Interface
Data Processing and Cloud Computing Server Room Visualization
Financial Data Analysis Graph with Growing Trends
Premium
Businessman Drawing Upward Arrow on Digital Stock Market Graph with Trading Data, Buy and Sell Indicators, Representing Financial Growth, Investment Success Foreign currency trading and Forex Trading
Global Financial Data and Statistics with Blue World Map Overlay
Financial Data Processing Over Digital Cityscape
Data Analytics with Dynamic Global Market Trends on Screen
Soundwave Visualization and Data Analysis on Digital Grid
Premium
Touching stock market graph on a touch screen device. Trading on stock market concept. Closeup photo.
Digital Data Analysis on World Map Grid with Global Connectivity
Digital Financial Data Analysis on Abstract Blue Background
Business Professionals Analyzing Financial Graphs in Modern Meeting
Digital Data Visualization Overlaying Sports Stadium
Premium
Businessperson working with AI-powered financial data analysis tools, showcasing advanced technology in finance. Ideal for fintech, AI research, and technology
Financial Market Love: Red Hearts and Economic Graph Integration
Dynamic Financial Data Analytics with Stock Market Trends
Financial Data Visualization with Mobile Payment Concept
Digital Trading Desk with Line Graphs Representing Market Trends
Premium
Explore the stock market trends for 2024 with analytical visuals of businessman planning long term investments and future business growth, Navigate towards success with smart strategies.
Abstract Financial Chart with Growing Cryptocurrency Trends
Financial Analytics Dashboard with Trend Lines and Data Visualization
Digital Stock Market Analysis with Falling Trend Arrow
Dynamic Digital Financial Chart with Market Trends and Data Analysis
Premium
Display of quotes pricing graph visualization.  Financial statistic analysis on dark background with growing financial charts. Stock analyzing. Price chart bars.
Dynamic Stock Market Dashboard with Graph and Charts
Futuristic Financial Data Visualization with Large Letter A
Dynamic Stock Market Chart with Currency and Candlestick Graphs
Digital Financial Analytics Dashboard with Trend Indicators
Financial Data Analysis Over Vibrant Cityscape Background
Global Financial Data Interface with Rotating Globe Overlay
Premium
Man look at the dashboard with graphs and charts. Concept of data management system, business intelligence, data statistics, marketing analysis, key performance indicators (KPI) and analytics.
Dynamic Financial Data and Graphs on Digital Interface
Dynamic Financial Graph Analyzing Market Trends
Financial Data Visualization Overlaying Modern Office Setting
Digital Data Visualization with Futuristic Infographics
Premium
Businessman using digital tablet analyzing sales data and financial growth graph chart report. Business planning, strategy and development. Financial and banking. market research, business analysis
Colombian Flag Merging with Stock Market Graphs Illustrating Economy
Dynamic Financial Graphs on Digital Screen Displaying Market Trends
Digital Soundwaves with Data Graphs and Coding Elements
Financial Growth Chart with Digital Data Interface
Premium
Businessman pointing chart financial goals and economic business planning global.
Futuristic Stock Market Graphs on Digital Display
Financial Data Graphic with Rising Trends on Digital Grid
Abstract Data Visualization with Retro Future Digital Interface
Dynamic Financial Graph with Data Analysis Conceptual Background
Premium
Businessman in suit analyzes stock market data using digital tablet and stylus with financial charts in the background. Investment, finance, trading. Stock market and analytics.
Futuristic Financial Data Visualization with Neon Overlay
Dynamic Financial Dashboard Displaying Bar and Line Charts
Dynamic Financial Data Graph Illustrating Stock Market Trends
Digital trading screen with rising charts and data analytics
Premium
Hands holding a tablet with glowing bar and line charts, global map, and financial data visuals on a dark background. Concept of stock market analytics
Dynamic Financial Graphs and Dashboard Analytics
Business Professionals Analyzing Financial Growth Figures
Financial Data Visualization with Charts and Graphs on Dashboard
Digital Financial Chart With Trend Lines and Analytics Display
Premium
A vibrant financial chart displays stock market data against a city skyline at dusk, emphasizing dynamic market fluctuations
Fluctuating Financial Stock Chart Display with Candlesticks
Digital Candlestick Chart with Percentages and Analytics Lines
Sustainability Finance Dashboard Displaying CO2 Emissions, Euro Trends and Growth Metrics
Dynamic Financial Data Overlaying Urban Cityscape
Dynamic Stock Market and Financial Data Analysis Concept
Abstract Financial Graphs Overlapping Urban Skyline
Premium
Dashboard finance management on laptop computer analyzing sales data and growth graph chart report. Business planning, strategy and development. Financial accounting. market research, data analysis
Financial Data Processing with Global Business Analytics
Digital Financial Data Analysis Overlay in Modern Office
Dynamic Financial Graphs Illustrating Market Trends and Data
Dynamic Analysis of Stock Market Trends and Patterns
Premium
Business visual data analyzing technology by creative computer software . Concept of digital data for marketing analysis and investment decision making .
Dynamic Financial Data and Arrows with Technology Interface
Financial Data and Stock Market Trends Overlaying Cityscape
Dynamic Financial Data with Global Connections and Insights
Digital Finance Graph with Data Points on Dark Background
Premium
Futuristic Digital Growth Chart – 3D Bar Graph with Glowing Blue Data Visualization
Financial Data Charts with Viewing Grid in Dark Perspective
Abstract Digital Financial Data Graph Chart
Dynamic Stock Market Chart with Shoe Icons Overlay
Dynamic Stock Market Data on Digital Display
Premium
Digital economic growth chart with a rising trend towards 2025, symbolizing future market predictions.
Paris Architecture Illuminated by Financial Market Trends Overlay
Global Financial Trading with Data Analytics Display
Dynamic Candlestick Graph with Data Lines and Figures for Analytics
Financial Market Chart with Candlestick Patterns and Trend Analysis
Premium
A professional businessman showcases stock market data through a digital interface, set against a modern city backdrop, emphasizing the importance of financial analysis in investment strategies.
Data Analytics Dashboard Displaying Growth Indicators
Digital Financial Analytics Dashboard Displaying Diverse Data Visualizations
Dynamic Digital Interface with Stock Market Tickers
Dynamic Stock Market Visualization with Trendlines and Tickers
Premium
Two Digital Computer Screens with Financial Analytical Data in Modern Monitoring Office. Control Room with Finance Specialists Sit in Front of Computers.
Financial Charts with Blue and Red Lines and Digital Percent Indicators
Market dashboard displaying candlestick chart, volume profile and moving averages
Futuristic Financial Data Visualization Over City
Global Financial Data and Analytics Overlay
Dynamic Financial Data Display Over Global Stock Market
Financial Data Display in Digital Grid Design
Premium
Businesswoman analyzes to chart data business on a visual screen dashboard, technology devices and screens visible in the background, financial planning, market research, and the stock market.
Futuristic Graphs Over Cityscapes Indicating Global Financial Data Trends
Financial Data Visualization in Server Room Setting
Abstract Financial Data with Digitally Enhanced Graphs
Financial Graphs Overlaying Cityscape Illustrate Global Economy
Premium
Financial chart and investment graph analysis stock on tablet screen. Data dashboard and report insight for finance growth, stock market, and business performance strategy.
Abstract Financial Data Over Cityscape Imagery
Digital Data Analytics Growth Trend with Graphs
Dynamic Financial Data Growth Chart Display
Dynamic Financial Data Trends with Fluctuating Graphs and Charts
Premium
A magnifying glass over a financial chart, illustrating market analysis and business concepts, in blue light against a dark background.
FinTech Global Data Chart with Statistical Analysis
Financial Data Trends on Stock Market Graph
Digital Financial Data Display with Graphs and Statistics
Financial Data Overlay on Environmental Pollution Concept
Premium
Professional Financial Data Analysts Working in a Modern Monitoring Office with Live Analytics Feed on a Big Digital Screen. Monitoring Room with Finance Specialists Sit in Front of Computers.
Futuristic Data Visualization with Dynamic Graphs
Financial Data Analysis Dashboard with Charts and World Map
6G Network Concept with Financial Graph Interface
NFT Trading Analytics Dashboard with Graphs and Data Metrics
Premium
Persons Hand Holding Tablet Digital Financial Graph Analysis, Upward Chart Showing Growth, Business Interface, Stock Market Data, Smartphone Interaction
Digital Financial Data Analysis with Candlestick Graph and Trend Line
Futuristic Technological Finance Data with Digital Analysis Grid
Futuristic Green Pound Symbol Amid Financial Data Charts
Financial Analytics Dashboard with Growth Trends and Indicators
Premium
Businessman analyzing stock market chart with stylus pen on virtual screen, representing financial trading, investment analysis, and stock market data visualization
Candlestick and line market chart visualizing stock performance with percentage gain labels