
- Home >
- Stock Photos >
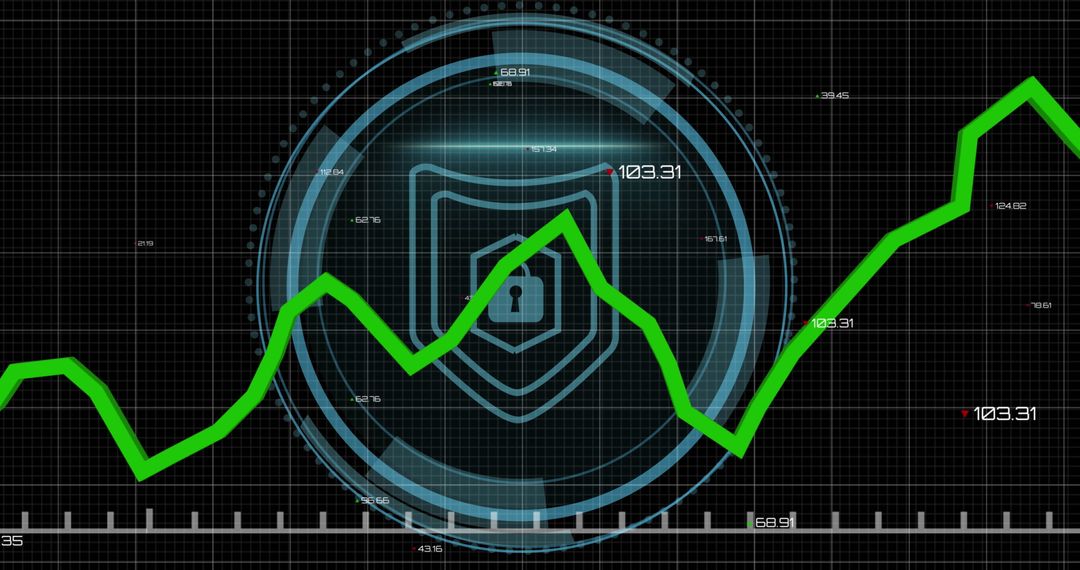
- Dynamic Financial Graph Showing Market Trends
Dynamic Financial Graph Showing Market Trends Image
Colorful graphical lines depict fluctuations in the stock market or financial data on a digital screen. This visual is ideal for presentations, reports, and articles about the stock market, economic changes, or investment opportunities. The contrasting lines highlight up and down trends, engaging viewers seeking insights into market dynamics.
Powered by  - Get 15% off with code: PIKWIZARD15


4
downloads
downloads
Tags:
More
Credit Photo
If you would like to credit the Photo, here are some ways you can do so
Text Link
photo Link
<span class="text-link">
<span>
<a target="_blank" href=https://pikwizard.com/photo/dynamic-financial-graph-showing-market-trends/28ce9f49bbef43a437885cfa26be6f8d/>PikWizard</a>
</span>
</span>
<span class="image-link">
<span
style="margin: 0 0 20px 0; display: inline-block; vertical-align: middle; width: 100%;"
>
<a
target="_blank"
href="https://pikwizard.com/photo/dynamic-financial-graph-showing-market-trends/28ce9f49bbef43a437885cfa26be6f8d/"
style="text-decoration: none; font-size: 10px; margin: 0;"
>
<img src="https://pikwizard.com/pw/medium/28ce9f49bbef43a437885cfa26be6f8d.jpg" style="margin: 0; width: 100%;" alt="" />
<p style="font-size: 12px; margin: 0;">PikWizard</p>
</a>
</span>
</span>
Free (free of charge)
Free for personal and commercial use.
Author: Awesome Content
Similar Free Stock Images

Premium


Premium


Premium


Premium


Premium


Premium


Premium


Premium


Premium


Premium


Premium


Premium


Premium


Premium


Premium


Premium


Premium


Premium


Premium


Premium


Premium


Premium


Premium


Premium

